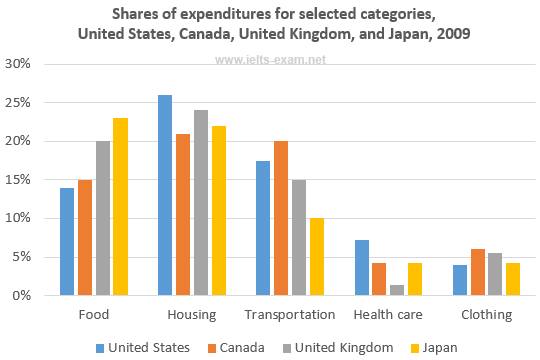
The graph gives the information about the proportion of money spent on five different items in 2009 and it is measured in the percentage. Overall, except Japan, all countries spent their household budget on housing.
Comparing the countries, it is found that the United States showed it is superiority on both housing and healthcare at 26 and 7 percent, but it was the least spender on clothing and food. Meanwhile, Japan predominated on food but was the lowest on transportation, at the same time, Canada witnesses the highest rate among all in clothing at 5 and transportation at 20 whereas it is an expense on housing was the least.
Turning to health care and clothing, United States dominated it is expenditure on health care at 7%. This following by Canada and Japan having the same proportion while the lowest position was occupied by the UK. Meanwhile, all countries had a less marked difference on healthcare and the domination was seen in Canada figure.

bar.jpg
