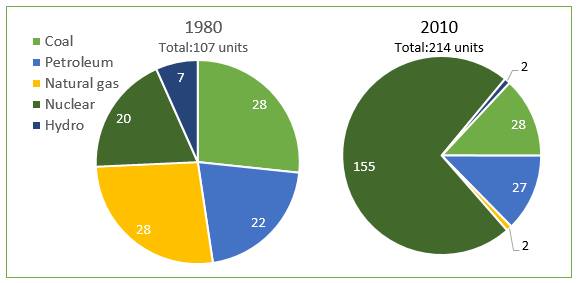
A breakdown of the information about source of generating electricity in Germany is depicted in the pie chart. It is measured in units between 1980 and 2010. Overall, it can be seen that, nuclear rose dramatically, while natural gas witnessed a sharp decline over 3-decade period.
With regards to the three highest resources of electricity generation, in 1980, nuclear stood at 20 units, while coal and petroleum started at 28 and 22 units respectively. In the next 3 decades, the usage of nuclear as an energy grew sharply to the top of 155 units, while petroleum experienced a slight growth and coal remained unchanged. In addition, after 30 years, all sources of producing electrical energy doubled to roughly 107 units.
Concerning to the other two sources of electricity production, natural gas generated 28 units, while hydro only produced 7 units. Thirty years later, 2010 witnessed a tremendous plunge to the lowest level of natural gas usage. In the same year, hydro saw a significant decline to the identical number of source usage, at approximately 2 units.

944996_1020133978825.jpg
