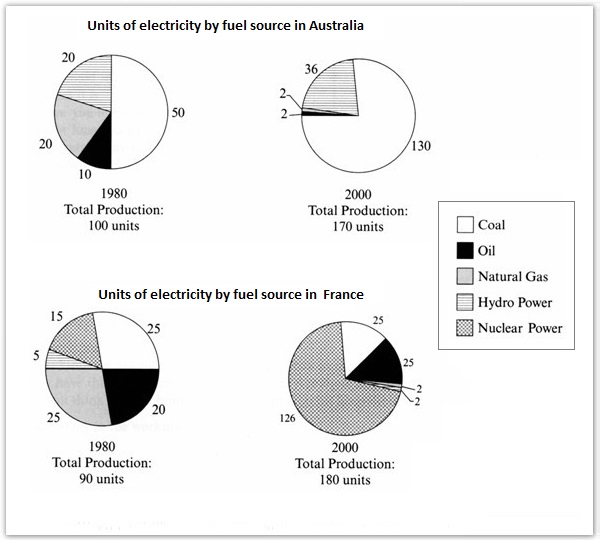
The pie chart below show units of electricity production by fuel sources in Australia and France in 1980 and 2000
The pie charts reveal the proportion of electricity produced using five different of fuels in two different countries in 1980 and 2000. Overall, eventough Australia and France increased their production, there were different pattern in the changes of fuel source precentage.
In 1980, Australia produced 100 units of electricity with half of it was come from coal source. That source just over three-quarters of all in 2000 when the country increased it's total production to 170 units. The hydropower source had also risen to 36% troughout the period. France, who produced 90 units of electricity in 1980, rose it's production to be doubled in 2000. The greatest change was in nuclear power source which moved up to approximately 75% of total production. Besides, both two countries experienced a significant decrease in natural gas source production.
Less change was seen in oil source production in Australia which fell slightly by 8%, while in France it rose slightly to 25%. At 5%, hydro power source was the less production in France then in the last period it turned down to only 2%. Coal source production remained unchanged in this country.
Total words : 188
different sources for electricity production in numbers
The pie charts reveal the proportion of electricity produced using five different of fuels in two different countries in 1980 and 2000. Overall, eventough Australia and France increased their production, there were different pattern in the changes of fuel source precentage.
In 1980, Australia produced 100 units of electricity with half of it was come from coal source. That source just over three-quarters of all in 2000 when the country increased it's total production to 170 units. The hydropower source had also risen to 36% troughout the period. France, who produced 90 units of electricity in 1980, rose it's production to be doubled in 2000. The greatest change was in nuclear power source which moved up to approximately 75% of total production. Besides, both two countries experienced a significant decrease in natural gas source production.
Less change was seen in oil source production in Australia which fell slightly by 8%, while in France it rose slightly to 25%. At 5%, hydro power source was the less production in France then in the last period it turned down to only 2%. Coal source production remained unchanged in this country.
Total words : 188

Academic_IELTS_Task_.jpg
