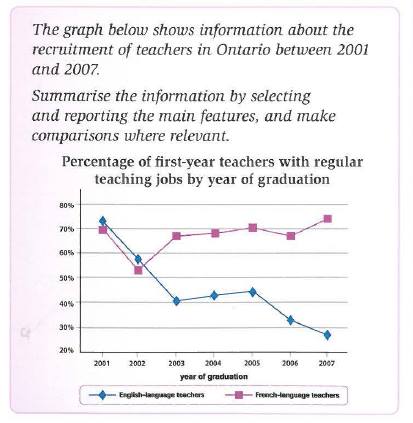
The explanation about the proportion of English and French language teacher in Ontario based on their graduated year from 2001 to 2007 is described in the line graph. Overall, French language teachers experienced slight rose, while the graph of English Language teachers showed the reverse by immense fell.
In 2001, both language teachers were in similar percentage at around 70% and over. Then, they experienced similar pattern until 2002 by went down to under 60%. However, the graph had 2002 until the rest of the period. In 2003, there was a sharp rose of French language teachers, went up to virtually 70% and kept going up until 2007, when it peaked at around 75%.
In contrast, English language teachers experienced dramatic fell to 40% in 2003. Continued by the rose and down for the following 4-year period. Even though there was a slight up in 2005 at around 45%, the graph of English language teachers show significant dropped until 2007 at just around 27%.

12376387_11978050535.jpg
