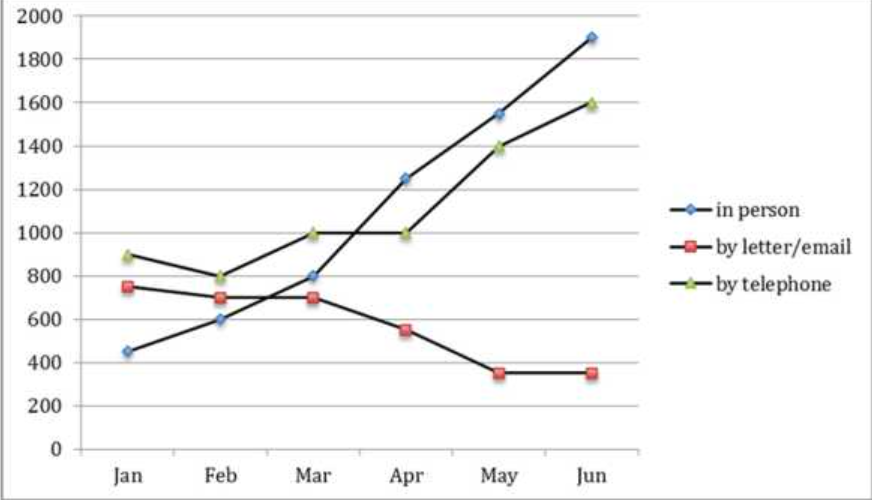
enquiries received by the Tourist Information Office
The given graph illustrates how many enquiries received in three different ways (person, letter/email, and telephone) in the TI Office, over the course of six months in 2011.
Overall, it is clear that the enquiries received by person and letter witnessed a high increase from January to June in 2011, while those by letter/email fell gradually in the same period. The line which figures for person raises from the lowest point (compared to another in Jun) to the highest point after six months.
In January 2011, The highest number of enquiries was recorded for telephone, at nearly 900, while those in person only standed at the lowest point (400 enquiries). The following months saw a significant rise in the proportion of requires in-person to its peak of over 1800 and substantial fluctuation in the figure for those by telephone between 800 to 1600.
On the other hand, the number of inquiries received by letter/email standing the second point in January at under 800, undergoes a slight decrease estimatedly 100 in March. Throughout the remainder of the period given, there was a sharp drop in the proportion of letter/email, at under 400 in June, which decrease a half compared with those in January.

the number of enquiries received by the Tourist Information Office in one city over a six-month
