enquiry methods in numbers
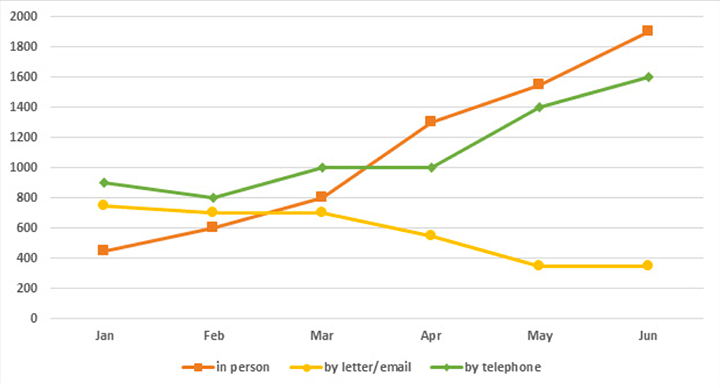
The provided line graph represents information about the figure for distinct methods by which questions were asked for the Tourist Information Office in a specific city in the first half of 2011.
A glance at the supplied graphs reveals that the requirement sent by telephone and in person increased a sharply upward trend compared to a gradual decline by letter or email by the Tourist Information Office in a municipality within a time span of the first 6 months of 2011.
It is worth noting that making enquiries by telephone commenced from the bottommost mark by a little less than a half million, retained growth, and had an enormous surge to reach the vertex at roughly 2 million as an ending. The number of enquiries received in person started at the highest level, followed by a decrease from 900 to very nearly 800 in February before going to the doubled figure for enquiries in June.
On the other hand, it was quite the opposite of the data on the number of questions received by letter/email which experienced a constant drop until the end of the given period and touched the all-time low at around 400 queries.

h.png
