Hi, this is the first time I use this site. Can you help me to find my mistakes in this writing please. That will be very kind of you. Thank you so muchhhhhh!!!
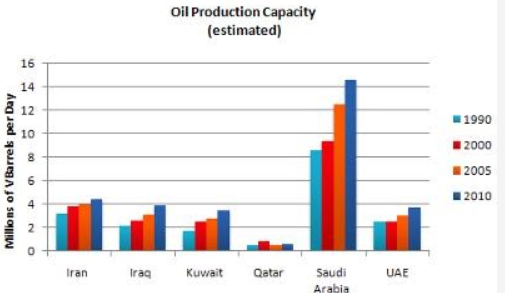
The table below shows the estimated oil capacity of six countries, in millions of barrels per day, from 1990 to 2010.
Summarise the information by selecting and reporting the main features, and make comparisons where relevant.
You should spend about 20 minutes on this task.
Write at least 150 Words.
The presented bar chart illustrates the estimated oil production capacity in six different Gulf countries namely Iran, Iraq, Kuwait, Qatar, Saudi Arabia and UAE, in four years 1990, 2000, 2005, 2010, measured in million barrels per day. Overall, the oil production of most countries tends to increase from 1990 to 2010, except for Qatar. It is crystal clear that Saudi Arabia produced the largest amount of oil throughout this period whilst that of Qatar was the least.
In 1990, Saudi Arabia produced a significant quantity of over 8 millions barrels of petroleum daily, which is about four times higher than that of the rest . This continued to rise steadily and reached its peak at a little higher than 14 millions of barrels per day in 2010. In contrast, the lowest oil producing country was Qatar. It produced under 1 million barrels per day in all given years. However, there had been a marginal increase in 2000.
As for the four remaining countries, their oil generating capability was approximately between two and four millions of barrels per day throughout the decades. Over time, the production capacity gradually improved and reached around 4 millions of barrels per day in 2010. Iran's capability was slightly higher than that of Iraq, Kuwait and UAE.
oil production capacity
The table below shows the estimated oil capacity of six countries, in millions of barrels per day, from 1990 to 2010.
Summarise the information by selecting and reporting the main features, and make comparisons where relevant.
You should spend about 20 minutes on this task.
Write at least 150 Words.
The presented bar chart illustrates the estimated oil production capacity in six different Gulf countries namely Iran, Iraq, Kuwait, Qatar, Saudi Arabia and UAE, in four years 1990, 2000, 2005, 2010, measured in million barrels per day. Overall, the oil production of most countries tends to increase from 1990 to 2010, except for Qatar. It is crystal clear that Saudi Arabia produced the largest amount of oil throughout this period whilst that of Qatar was the least.
In 1990, Saudi Arabia produced a significant quantity of over 8 millions barrels of petroleum daily, which is about four times higher than that of the rest . This continued to rise steadily and reached its peak at a little higher than 14 millions of barrels per day in 2010. In contrast, the lowest oil producing country was Qatar. It produced under 1 million barrels per day in all given years. However, there had been a marginal increase in 2000.
As for the four remaining countries, their oil generating capability was approximately between two and four millions of barrels per day throughout the decades. Over time, the production capacity gradually improved and reached around 4 millions of barrels per day in 2010. Iran's capability was slightly higher than that of Iraq, Kuwait and UAE.

169591734_7944185714.png
