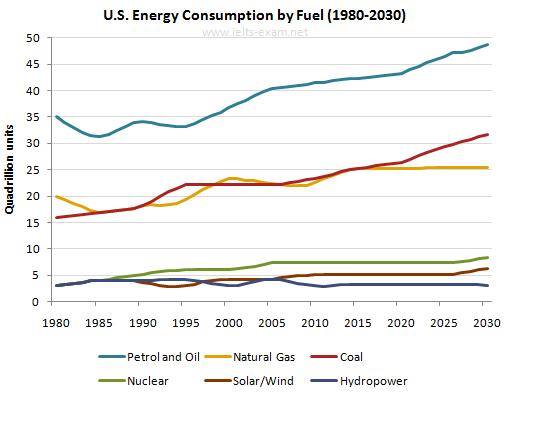
The graph below gives information from Annual Energy Outlook 2008 about consumption of energy in the USA since 1980 with projection until 2030.
The line chart shows how many production of six kinds of fuel based on the amount of people using energy in America from 1980 to be was estimated in 2030 and is measured in trillion units per five years by using Annual Energy Outlook 2008. At first glance, it can be seen that, there has been an upward trend of the using of petrol and oil, natural gas, coal, nuclear, solar or wind and hydropower.
Moving to a more detailed analysis, petrol and oil having the largest number consumed by many American, it began at 35 quadrillion units and was predicted be able to reach the biggest consumption in 2030, around 49 quadrillion units of petrol and oil. There was intersectional both natural gas and coal. In 1980, the production of natural gas was larger than coal, otherwise the prediction in 2030. On the other hand, the production of nuclear, solar and hydropower was similar in 1980. Interestingly, hydropower was projected to be the smallest production in 2030.
Turning to the kind of the fuel, liquid fuels had a large range between petrol and solar based on the trend. American tended to use petrol and oil than solar or wind for the kind of liquid fuels, was proven by using those fuels. In 2030, the production of solid fuels and gaseous fuels will be equal.

The_line_chart.jpg
