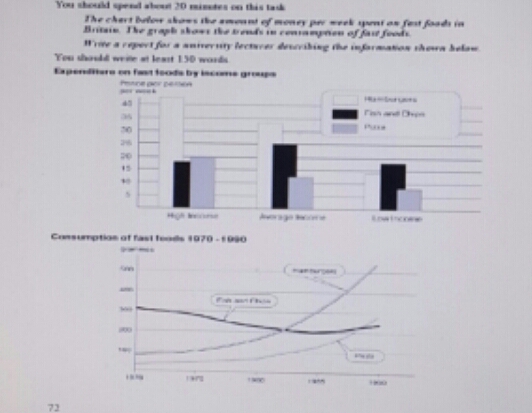
The bar chart illustrates the information about spending money per week on fast food by Britons, while the graph shows consuming Hamburgers, fish and chips and Pizza in Britain between 1970 and 1990. Looking at first chart below, there are given three groups of income on pence each person per week and in the second graph, there are given data regarding three types of fast food grammes during a period of 20 years.
according to the information, in high income and average income, more consumers probably ate hamburgers, while there was an increase of 25-pence expending for consuming fish & chips. In the low income group, pizza was decreased about 8 pence of expenditure and this spending was smaller than fish and chips, while were slightly larger than hamburgers about 15 pence per week.
Looking at the line graph, it Illustrates both hamburgers and Pizza that increased steadily to about 300 grammes during more than 15 years period, while there were slight decrease on fish and chips from 300 grammes to closely 200 grammes between the same periods. After late 1980s, hamburgers increased dramatically over 500 grammes. At the end of the year in this graph, hamburger and pizza rose notably, while fish and chips continued to rise slightly about 200 grammes.

PicsArt_139488773315.jpg
