Unanswered [2]
  

Home / Writing Feedback   % width   Posts: 2


Task 1, The expenditures for five major categories in the US, Canada, the UK, and Japan in 2009


phuongtrinh11200 3 / 4  
Jun 6, 2021   #1

shares of expenditures for selected categories


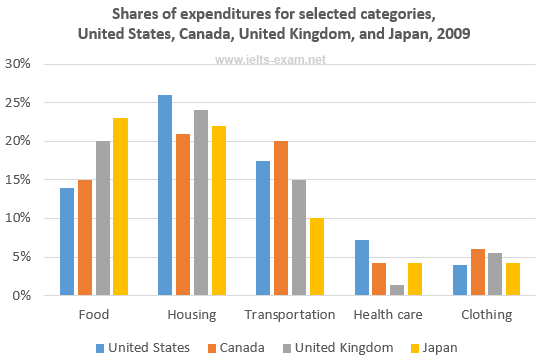
The bar chart illustrates the amount of money spent on five main items in four different countries including the US, Canada, the UK, and Japan in 2009.

It is clear that while the largest amount of money was spent on Housing in the US, Canada, and the UK, the figure for Food was the highest in Japan. Also, it is notable that the percentage of consumer spending on Healthcare and Clothing was the lowest in the four cities.

As can be seen from the chart, the US expenditure on Housing was the highest with just over 25%, which was substantially higher than Japan's expenditure, at only about 22%. However, the proportion of consumer spending on Food in the US was much lower than the figure for Japan, at approximately 30%. In addition, the US and Japan had the lowest percentage of consumer expenditure on Clothing, at only nearly 5%.

Regarding the expenditures in Canada and the UK, the figure for Housing in the UK stood at nearly 25%, compared with only 21% for Canada. Conversely, the percentage of consumer spending on Transportation and Health care in Canada was much higher, with 20% and nearly 5% respectively. In addition, the UK and Canada spent the lowest amount of money on Clothing, at just over 5%.

  • task1table.png


Holt  Educational Consultant - / 15460  
Jun 7, 2021   #2
The bar chart illustrates

The bar chart is divided into 4 sections. Include that reference as the individual items are listed / measured per country. Remember, the summary needs3-5 sentences to be considered complete. That is inclusive of the tending statement.

five main items

what are those items 1
Enumerate. Seperate your information into individual sentences. Your presentation is a GRA violation as it is a run-on sentence.

cities

Incorrect. The reference is countries, which is totally different from cities. Use a more correct synonym like region, realm, or sovereign state.

spending on Food in the US was much lower than the figure for Japan, at approximately 30%

Whose expense is the 30% referring to? The subject off that information is unclear. Always relate the figure to the country. failure to doso affects the reference clarity and the accuracy of your grammar.


Home / Writing Feedback / Task 1, The expenditures for five major categories in the US, Canada, the UK, and Japan in 2009
ⓘ Need Writing or Editing Help?
Fill out one of these forms for professional help:

Best Writing Service:
CustomPapers form ◳

Graduate Writing / Editing:
GraduateWriter form ◳

Excellence in Editing:
Rose Editing ◳

AI-Paper Rewriting:
Robot Rewrite ◳