Hi. I've tried to decribe the chart. Could anyone highlight all the mistakes in my description so I could work on them. I've read a lot of ielts related materials and tried to apply them :)), but I'm not sure about the correctness of what I did.
__________________________________
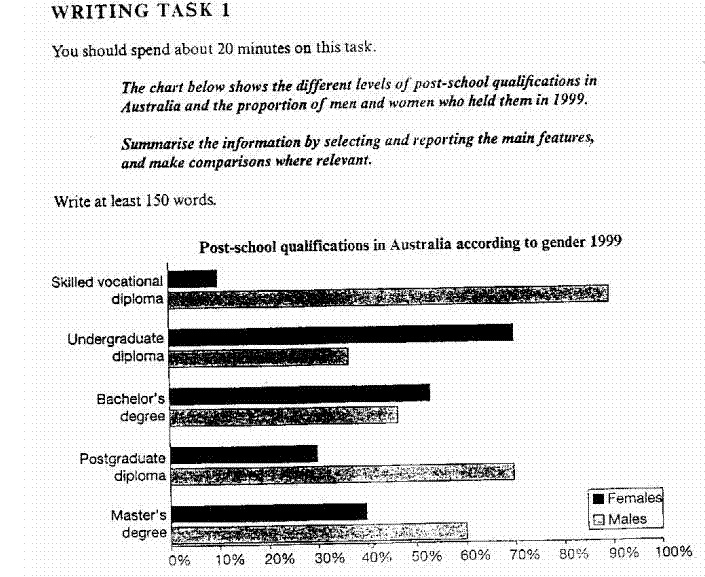
The bar chart comapres figures for different rates of post-school qualifications between men and women in Australia in 1999.
It is obvious from the chart that in three out of five given post-school qualifications the percentage of men was higher than that of women.
The figure for men with skilled vocational diploma was at 90%, compared to just 10% of women. The proportion of male postgraduates to female postgraduates was 70% to 30%. The difference between those with master's degree was not that significant, but still rather apperent, with the benefit of men at 60% to 40%.
Bachelor's degree and undergraduate diploma were the two qualifications with female dominance. The percentage of female undergraduates at 65% was almost twofold higher than that of male undergraduates at 35%. The proportion of women to men with bachelor's degree were pretty equal 55% to 45%.
Interestingly, that the difference between the two post-school qualifications with female dominace and the two qualificatons with male dominance where pretty similar, in comparison with skilled vocational diploma.

chart
