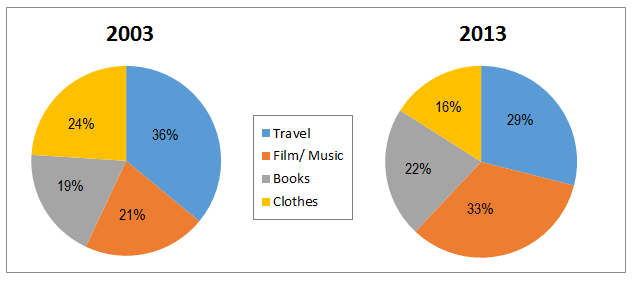
The figure of four different features which were mostly interested in 2003 and 2013 are compared by those two pie charts. At first glance it is evident that film/ music gaining the enormous alteration of the proportion.
The mostly chosen feature in 2003 was presented by travel; however, in ten years later, it decreased to 8% lower than previous proportion. Reaching almost a quarter at total features in 2003, clothes followed the travel in the second level. Then, it fell dramatically to 16% which caused it obtained the lowest percentage. In addition, film/music acquired the highest change in percentage for a 10-year period.
Unlike three other features, book did not achieve that much alteration. Initially, the book provided 19% and then it increased slightly in ten remain years. Although the proportion experienced the improvement during the period as a whole, book admitted the last place in 2013.

Academic_IELTS_Writi.png
