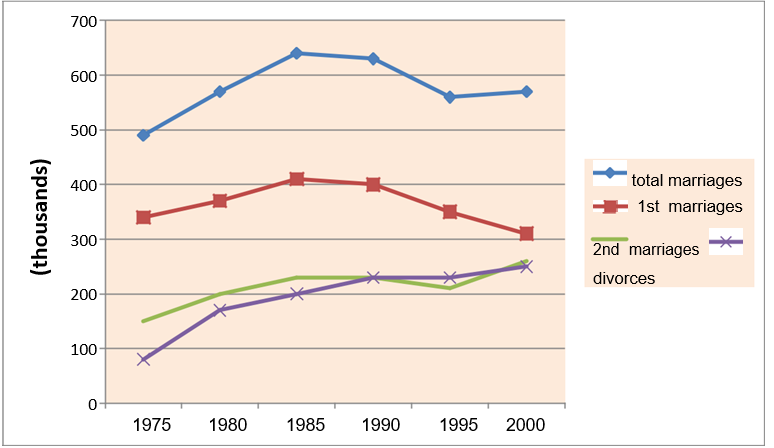
the number of marriages and divorces in the UK
The line chart illustrates the figure for marriages and divorces in the UK over a period of 25 years, from 1975 to 2000. Overall, the number of total marriages experienced a gradual increase whereas the number of 1st marriages decreased and the figure for divorces rose.
In 1975, there were about 500 thousands of marriages and continued to increase dramatically in the next 10 years, reached a peak of over 600 thousands of marriages in 1985. Despite a gradual decrease in 1995, the figure rose again at the end of the period, about 570000. By contrast, the numbers of first marriages rose from 330000 marriages to over 400000 from 1975 to 1985 before falling rapidly to just over 300000 in 2000.
It can be easily to be seen that the figure for 2nd marriages was only about 180000 in 1975, it then increased steadily to 250000 by the end of the period. Despite being just about 80000 divorces in 1975, the number experienced an exponential increase to reached a peak of 250000 by 2000, at times overtaking the figures for second marriages.

Untitled.png
