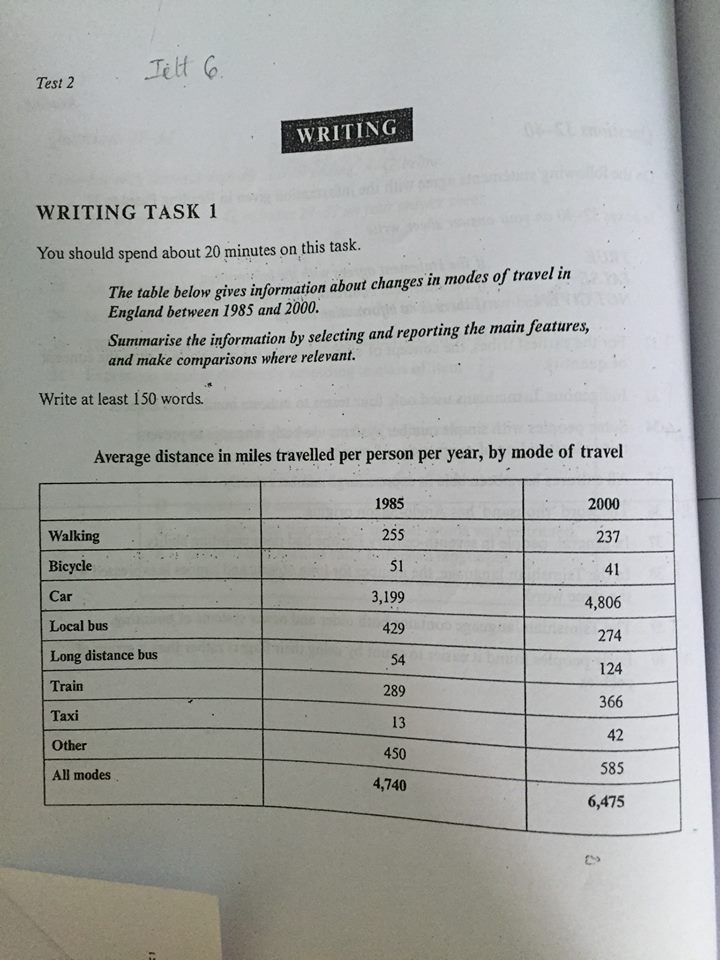
Ielts TASK 1: Information About Changes in Modes of travel in England between 1985 and 2000
Figures regarding variations in using transport to travel in England between 1985 and 2000 is revealed in the graph. Overall, the average distance in miles travelled by walking, bicycle and local bus tended to decline, while that by car, long distance bus, train, taxi and other increased during the periof of 1985 - 2000
As is shown by the graph, the average miles travelled by local bus experienced a significant decrease from 429 miles in 1985 down to nearly double of 274 miles. Beseides, the average miles by both walking and bicycle witnessed the same slight fall in which the former went down to 237 miles in 2000, comparing with 255 miles in 1985 and the latter drpopped from 51 miles to 41 miles in smiilar years.
By contrast, it can be clearly seen that the average distance by taking taxi rocketed from just 13 miles, the least average distance in 1985 to 42 miles in 2000. Moreover, the average miles travelled by long distance bus nearly trebled from 54 miles to 124 miles in a period of 15 years. In regard to car user, which seemed to be the most popular transport over the time, had a sustainable rise from 3199 miles in 1985 to 4806 miles in 2000. Subsequently, the average miles for travelling by train and other also went up steadily from 289 miles and 450 miles to 366 miles and 585 miles consecutively( is it the same meaning with " in order " ? ) between 1985 and 2000.
Thank you so much for picking out any mistakes <3

14212093_16117819791.jpg
