Unanswered [0]
  

Home / Writing Feedback   % width   Posts: 2


The first chart below gives information about the money spent by British parents on their children's


aitran2311 1 / -  
Feb 8, 2022   #1

average monthly spend on children's sports / participation statistics


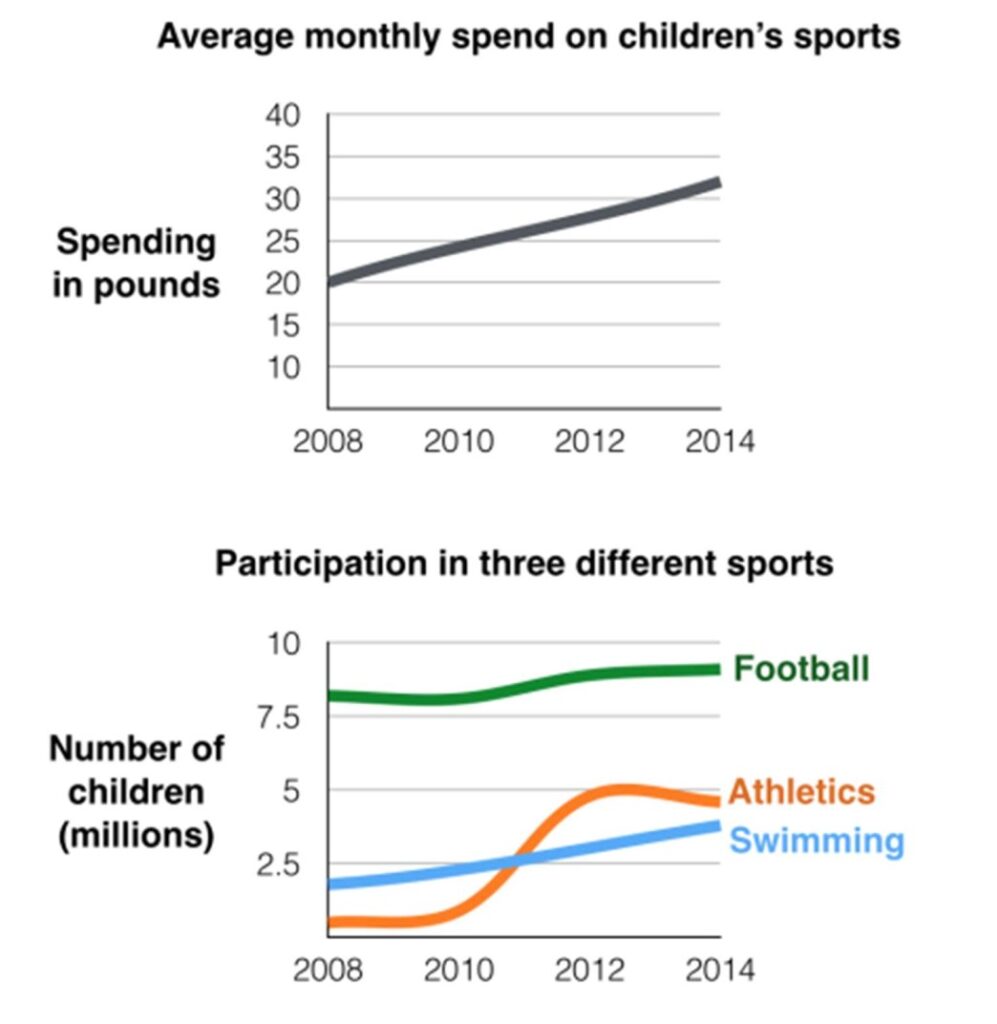
The first chart below gives information about the money spent by British parents on their children's sports between 2008 and 2014. The second chart shows the number of children who participated in three sports in Britain over the same time period

Given are the two charts which indicate the expenditure of parents in the UK on sports during the period of 7 years from 2008 to 2014 and the amount of children taking part in the three mentioned categories over the same timeline.

It is noticeable that the money spent on sports of British parents tends to increase gradually over years. In addition, football has always been the sporting activities that parents spent their money on the most.

In 2008, British families expended around £20 on a monthly basis for their kids to do sport. This figure rise steadily to over £30 per month in the next 6 years.

It can be clearly witnessed that the number of children participating in football dominated the highest rank of all three sports with around approximately over 8 millions which remained stable during the whole period of time. However, the number of young athletes have an incredible gain with only under 1 million participants in 2008 but ended up with nearly 5 millions children taking part in this sporting activities in 2014. Children who participated in swimming have a tendency to raise gently from just under 2.5 millions to approximate 4 millions swimmers, which means nearly double the figure.

  • Britishparentsont.jpg


Holt  Educational Consultant - / 15461  
Feb 9, 2022   #2
Given are the two charts

Good move identifying the number of charts in the image. However, for clarity needs, you should use 2 additional sentences that seperately identify the image functions. That way the reader will be extremely clear about the information per image. For example, you could have said:

Image 1 has been assigned for figures relating to... While image 2 was used to refer to...

Doing this will allow for a clearer trending paragraph reference as you will be able to refer to seperate image trends, without creating any possible confusion for the reader. By merging the trending statements with the summary overview using a single paragraph, you will be able to create a highly comprehensive summary paragraph for your presentation. It will meet all the checkboxes for a valid task representation.

In 2008,

This is not considered a complete paragraph as it is only composed of 2 sentences. It will not receive a full scoring consideration. A complete paragraph for the IELTS task 1 and 2 require at least 3 sentences, no more than 5. This is an incomplete analysis presentation.


Home / Writing Feedback / The first chart below gives information about the money spent by British parents on their children's
ⓘ Need Writing or Editing Help?
Fill out one of these forms for professional help:

Best Writing Service:
CustomPapers form ◳

Graduate Writing / Editing:
GraduateWriter form ◳

Excellence in Editing:
Rose Editing ◳

AI-Paper Rewriting:
Robot Rewrite ◳