First time posting my essay here to request your suggestion, error correction and idea to improve my writing.Thank you, everyone.
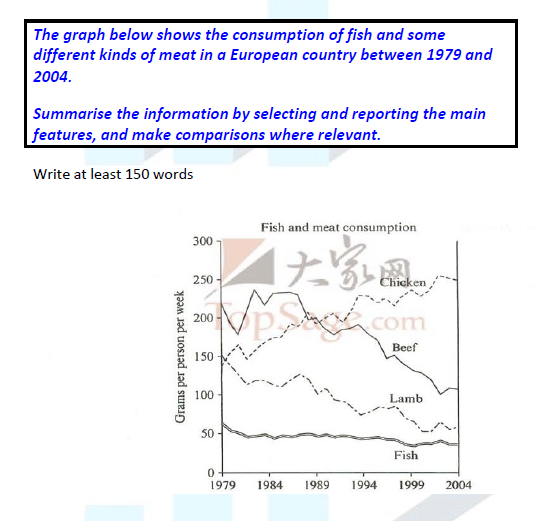
The line graph compares an European country's consumption rates of fish and different variety of meats from 1979 to 2004.
First of all, in 1979 the beef consumers trend was leading at the top with over 200g weekly although there was a short fall later. However, 230g of chickens were being consumed constantly during 10-year period before the market was deteriorated with 100g per person per week by 2004.
In 1979 there was an opposite trend between chicken and lamb consumers, despite same initials with 150g each. The market of chicken purchase was dramatically increased whilst lamb trend showed downward, with 250g and almost 50g respectively, in early twentieth century.
Lastly, only 60 grams of fish was weekly selected by minority of people in late nineteenth century and continued with same proportion throughout the period.
Overall, it can clearly be seen that only chicken trend showed upwards compared to beef and lamb demand, and the fish was standing at lowest consumption over the years.
consumption of fish and meats in an european country
The line graph compares an European country's consumption rates of fish and different variety of meats from 1979 to 2004.
First of all, in 1979 the beef consumers trend was leading at the top with over 200g weekly although there was a short fall later. However, 230g of chickens were being consumed constantly during 10-year period before the market was deteriorated with 100g per person per week by 2004.
In 1979 there was an opposite trend between chicken and lamb consumers, despite same initials with 150g each. The market of chicken purchase was dramatically increased whilst lamb trend showed downward, with 250g and almost 50g respectively, in early twentieth century.
Lastly, only 60 grams of fish was weekly selected by minority of people in late nineteenth century and continued with same proportion throughout the period.
Overall, it can clearly be seen that only chicken trend showed upwards compared to beef and lamb demand, and the fish was standing at lowest consumption over the years.

Untitled.png
