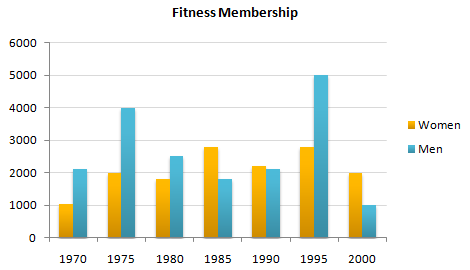
The chart below shows male and female fitness membership between 1970 and 2000.
The bar chart describes the membership of fitness between men and women over thirty years, from 1970 to 2000.
Generally, it can be seen from the chart that the number of two members of fitness fluctuated.
Since 1970 men became higher membership than women, then it increased highly at 4000 men in 1975. During twenty years, the number of men decreased but until 1995, it rose highly and reach a peak at 1995. After five years, in 2000, it went down significantly to the position 1000 members of men.
However, women started up at 1000 in 1970 and over fifthteen years, it rose highly at approximately 2800 and it felt down slightly then rose up again with the same number at 1985. In 2000, the number of membership of women decreased slightly to 2000 and became higher than men.

Fitness_memebership..png
