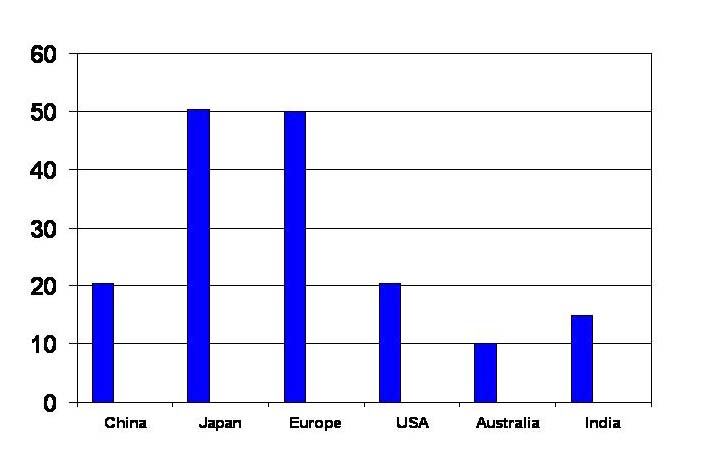
The bar chart demonstrates usage of flour in six different countries.
As we can see in the chart,Japan and Europe had consumed equal amount of flour and which is nearly by 50%. Other than that,the ratio of consumption flour in China and united states of America was lower than Japan and Europe but similar in percentages which were 20%.
Talking about the country who consumed the lowest amount of flour at that time,was Australia.Only 10% of flour had consumed by this country while people of India had participated in flour consumption with ratio of 15%
In a nutshell,the demand of flour in Japan and Europe is far more than Australia and India.
please tell me how is it?

ielts acadamic task 1
