The table shows forested land in millions of hectares in different parts of the world. Summarise the information by selecting and reporting the main features, and make comparisons where relevant. You should spend about 20 minutes on this task.
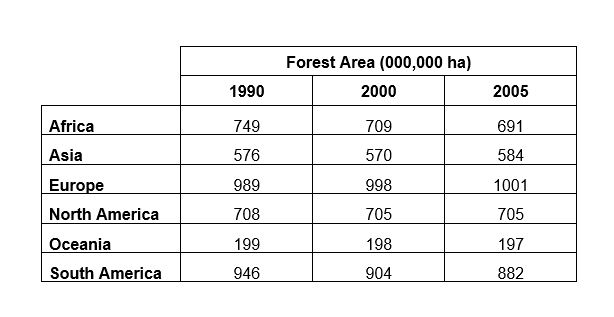
The table gives information referring the area of forests measured in hectares of various places in the world over the fifteen- year period from 1990 to 2005. Generally speaking, over the period as a whole, Europe had the largest forest area (1001 ha in 2005) associated with an obvious upward trend, in contrast to Oceania's figure (197 ha in 2005 with a slightly downward trend).
It is clear from the table that Europe and Asia were the only places of which the forest area were increasing. The figure of Europe came out first, 989 ha in the beginning of the period and maintained its position until 2005 (1001 ha). However, Asia witnessed a rise at a slower pace from 576 ha to 584 ha in 2005, only half of that of European.
To turn to the remaining regions, Africa and South America experienced a more significant decrease in comparison to Oceania and North America. Grouping Africa and South America together, it can be seen from the table that the South American figure was ahead of the African figure by a large margin throughout the period, 882 ha for the former versus 691 ha for the latter. North American figure went down insignificantly by 3 ha in 2000, and stood at that level until the end of the period, as opposed to the Ocieanian figure which hovering around 198 ha from 1990 to 2005.
changes in the wooden areas
The table gives information referring the area of forests measured in hectares of various places in the world over the fifteen- year period from 1990 to 2005. Generally speaking, over the period as a whole, Europe had the largest forest area (1001 ha in 2005) associated with an obvious upward trend, in contrast to Oceania's figure (197 ha in 2005 with a slightly downward trend).
It is clear from the table that Europe and Asia were the only places of which the forest area were increasing. The figure of Europe came out first, 989 ha in the beginning of the period and maintained its position until 2005 (1001 ha). However, Asia witnessed a rise at a slower pace from 576 ha to 584 ha in 2005, only half of that of European.
To turn to the remaining regions, Africa and South America experienced a more significant decrease in comparison to Oceania and North America. Grouping Africa and South America together, it can be seen from the table that the South American figure was ahead of the African figure by a large margin throughout the period, 882 ha for the former versus 691 ha for the latter. North American figure went down insignificantly by 3 ha in 2000, and stood at that level until the end of the period, as opposed to the Ocieanian figure which hovering around 198 ha from 1990 to 2005.

58a215c497604be9a.jpg
