IELTS WRITING TASK 1 : CAMBRIDGE BOOK 5.5 - 6.5 | UNIT 7 PAGE 46
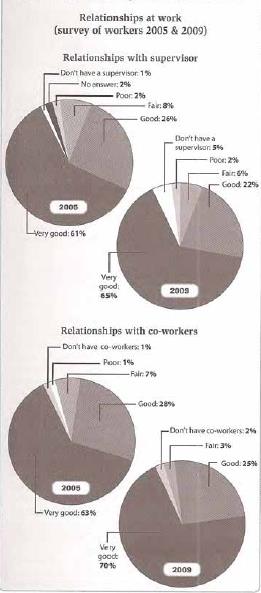
There are 4 pie charts display about worker's relationship with their boss and peers that gained from surveys in 2005 and 2009. Overall, they had very good relationship in all years and each year tend to have similar order.
It can be seen that there were two differences of relationship with supervisor in 205 and 2009. First, was the percentage. It only had less than 5 percent difference each of indicators. The highest were very good that increase from 61 percent to 65 percent in 2009, Good that decrease slightly by 4% into 22 percent, and do not have supervisor that rise from 1 percent to 5 percent. Second was the indicators. While some people were not give any answer in 2005 (2%), it did not appear in 2009.
In the next group that showed relationship with pair-work, most of the people had very good relationship both in 2005 and 2009, 63 percent and 70 percent respectively. That indicator also became the highest rise among the others with 7% upward. The charts also had a diverse indicators while in 2005 there was a poor indicator, it disappeared in 2009.

272252_1_o.jpg
