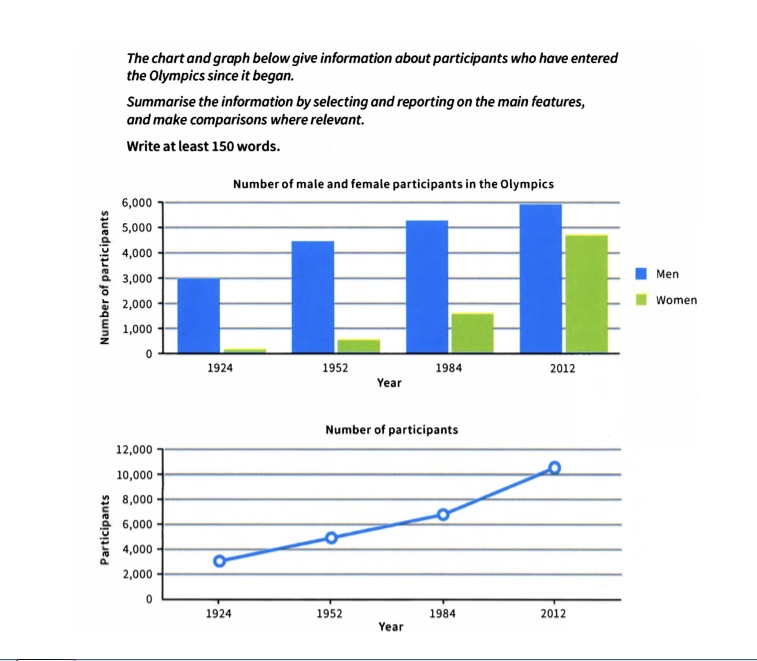
The chart and graph below give information about participants who have entered the Olympics since it began.
so here's my essay:
The bar chart and line graph illustrates the number of athletes who participated the Olympics from 1924 to 2012.
In summary, the number of male and female athletes in the Olympics increased significantly through the years and the number of participants had a substantial increase.
As can be seen from the bar chart, in 1924, the figure for male participants stood at 3000 people, while there were hardly any women entered the game. There was a considerably increase in the number of men and female next 60 years. In 1952, the figure for male climbed to 4500 people, but female increased slowly about 500 people. In 1984, the figure for female increased more 1000 people than of 1952 and the number of male athletes witnessed a dramatically increase about 700 people. In 2012, the figure for men reached its highest point of 6000 people, twice that of 1924. Meanwhile there was a considerable growth in the number of female participating in Olympics to 4800 people
Regarding the line graph, in 1924, there were about 3000 people attending this sport event, then it went up steadily in 60 years, it stood at 6500 athletes in 1984. In 2012, the number of participants peaked at 11000 people, five times higher than the figure for 1924.
That's my essay. ^^ i am thankful for anyone's feedback for me. thank you very much and have a good day!

F2BD71EA6A5C4A308.jpeg
