Unanswered [2] | Urgent [0]
  

Home / Writing Feedback   % width   Posts: 2


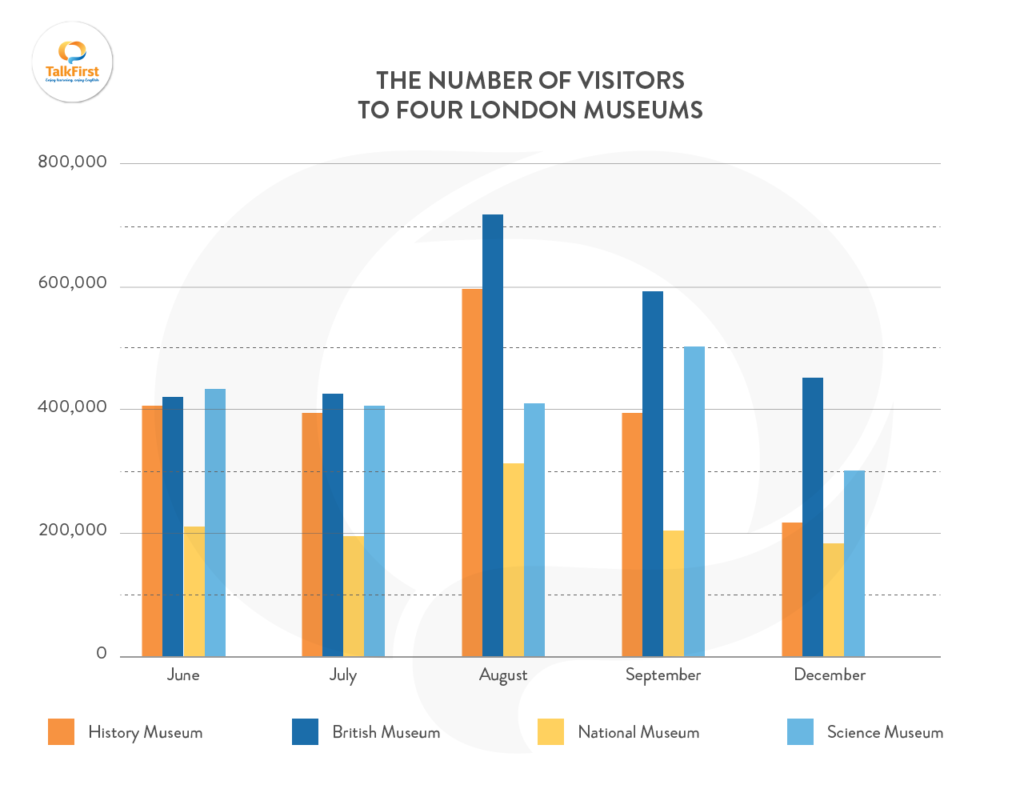
The given bar chart illustrates the number of people visiting four certain museums in London


ninhnb05 1 / -  
Nov 4, 2021   #1

London's museums visitors


The given bar chart illustrates the number of people visiting four certain museums in London during the period of 5 months starting from june.
In general, August witnessed the highest number of visitors in all four museums, especially British museum while nearly the lowest number of people going to the museums in december.

In terms of the first two months during the investigated period, British and science museums had the highest number of visitors of over 400000 people for both. In contrast, people visited national museum the least with the number of approximately 200000 which was nearly twice less than the other two mentioned museums.

Moving to the 3 months period starting from august, we witnessed a gradual decline by almost 300000 people who visited British museum. history and national museum also experienced a decrease in the number of visitors of over 400000 and 100000 respectively. The number of visitors to science museum, on the other hand, fluctuated during this period of time.

  • giaidethiieltswr.png


Holt  Educational Consultant - / 15347  
Nov 7, 2021   #2
four certain museums

The 4 museums have reference names in the chart. For summary compliance , you have to mention the number then list the museum names.The list helps keep the vader on track once reading the trending statement. Notice that you mention one museum name as the high, you should mention the name of the low as well. That shows the reader an overview analysis on your end and further clarifies the purpose of the report. Be specific be precise. your starting score depends on it.

first two months during the investigated period

Use the specifics as indicated in the image. The months are given for a purpose, to help the reader understand your report. The reader will be confused by the erratic information presentation. Once confusion and stress sets in for the reader, your scores will suffer in at least 2 ways.


Home / Writing Feedback / The given bar chart illustrates the number of people visiting four certain museums in London
Do You Need
Academic Writing
or Editing Help?
Need professional help with your assignments? Fill out one of these forms:

Graduate Writing / Editing:
GraduateWriter form ◳

Best Essay Service:
CustomPapers form ◳

Excellence in Editing:
Rose Editing ◳

AI-Paper Rewriting:
Robot Rewrite ◳