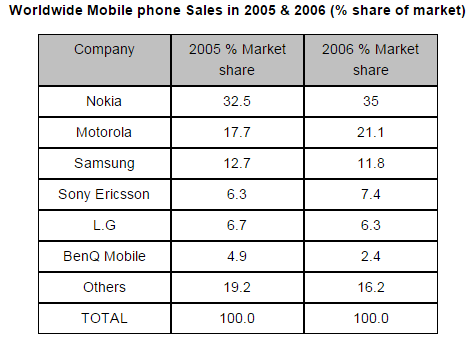
The chart illustrates the global market share of mobile phone sales in a 2-year period for manufactures, which is measured by percentage. Overall, it can be seen that there is no significant changes for every item in two years. In any case, even though Nokia phone was still in the top rank in this time frame, BenQ Mobile remained stagnant in the deepest position.
To begin, there was slight increase in Motorola's market share from 17.7% to 21.1. in contrast, Samsung's market decreased gradually between 12.7 percent to 11.8 percent. Furthermore, the similar case also showed by Sony Ericsson and L.G. in 2005, Sonny's products rose with the gap 1.1% to 7.4%. on the other hand, at 6.7%, L.G productions fell to just 6.3%.
Slow decrease was showed by Nokia's percentage from 32.5% to over a third, representing the highest proportion between 2005 and 2006. However, while BenQ's items are only sold 4.9% in 2015, it was being the non-favorite product in 2006 at 2.4%. Unfortunately, other companies in mobile phone sales only had 19.2% market share in first year, and then fell down to 16.2 percent in the following year.

Capture4.PNG
