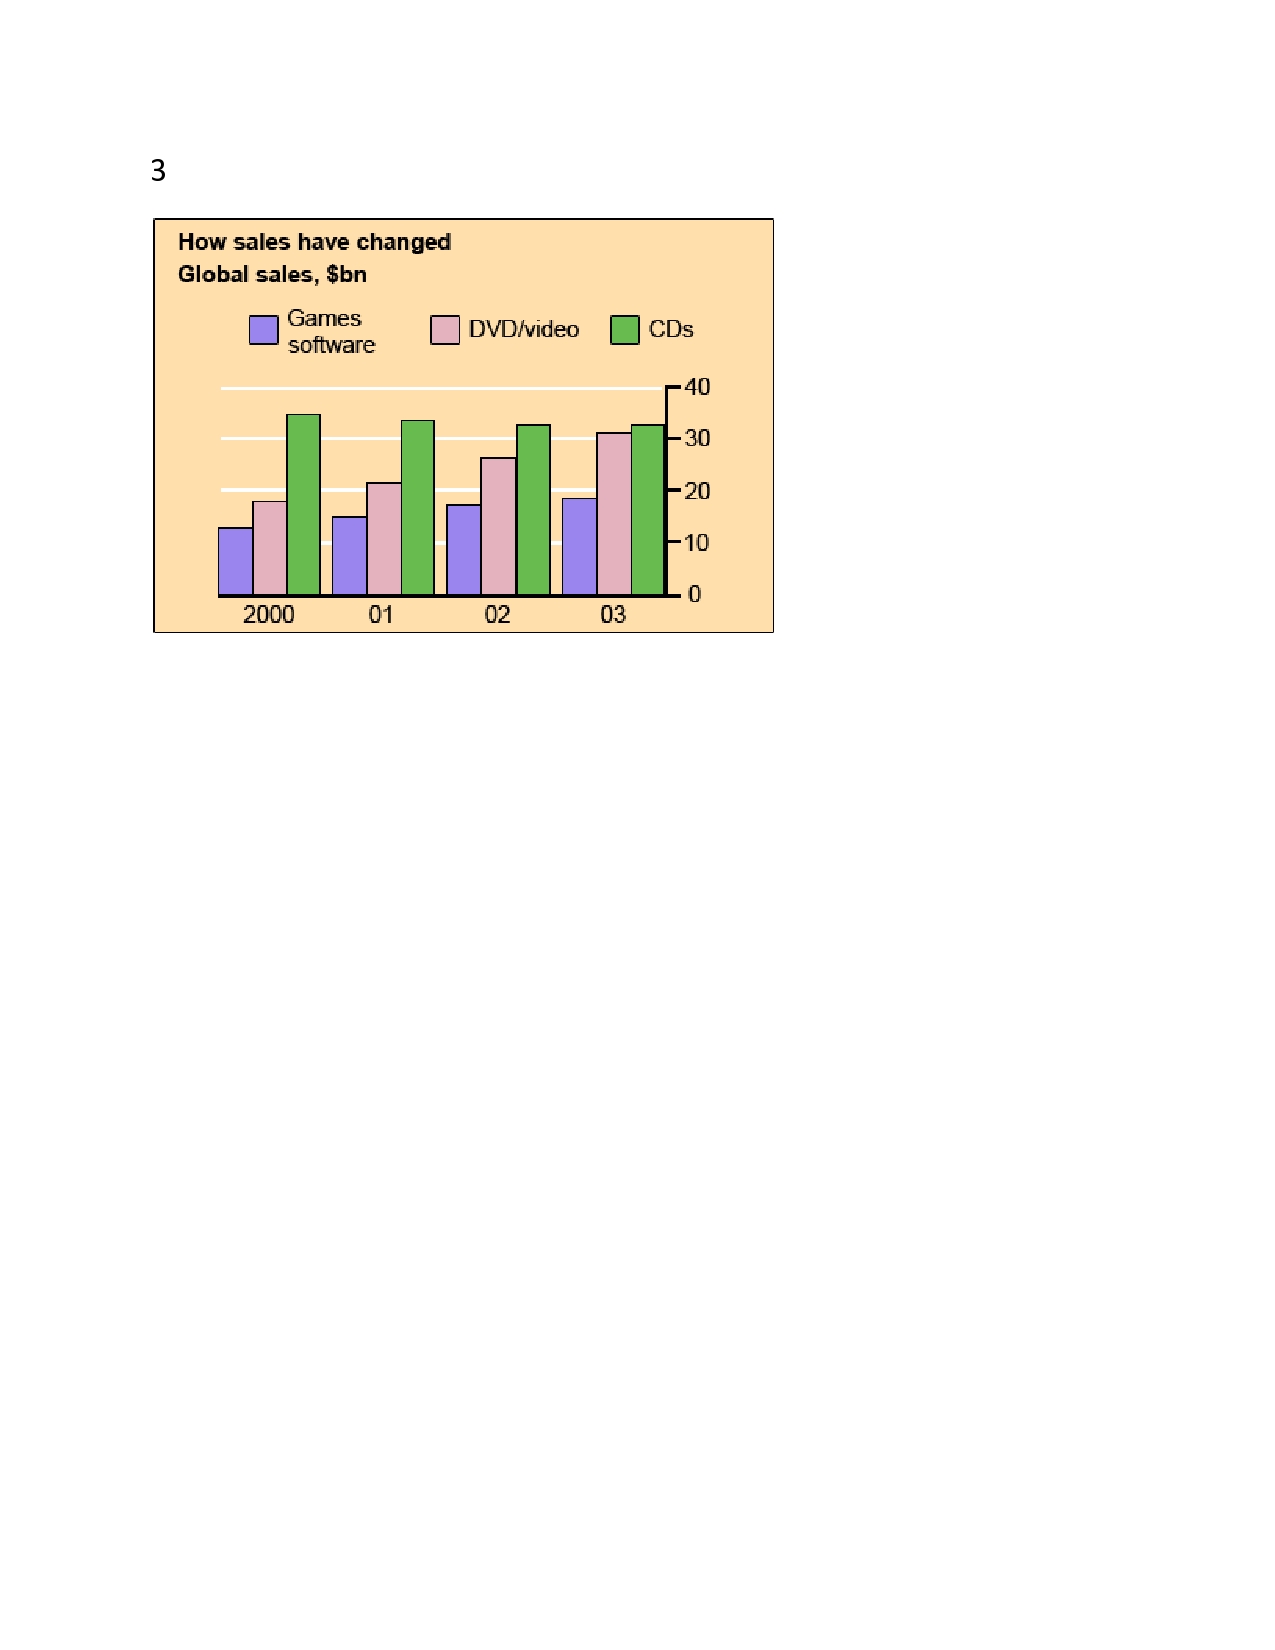
The chart below gives information about global sales of games software, CDs and DVD or video.
Write a report for a university lecturer describing the information.
- You should write at least 150 words.
You should spend about 20 minutes on this task.
The given bar chart illustrates the changes in the global sales of game software, DVD/Video and CDs between the three years of 2000 to 2003.
There was a gradual slight drop in the sales of CDs during this three years period. In 2000, it was 35 billion dollars, reached to 31billion dollars in 2003. In case of games software, there was a slight continuous increase in the sales. In 2000, it was 12 billion dollars, which touched to 19 billion dollars in 2003, an increase of 7 billion dollars after three years. In the same period, the sales of CDs showed a significant increase without any drop. In 2000, it was 18 billion dollars reached at the peak of just above 30 billion dollars in 2003.
The sale of CDs was only one third of the sale of CDs in 2003, gained its popularity and became half of the sale of the CDs in 2003. The sale of the DVD/Video in 2000 was below half of the sale of the CDs in 2000, reached almost equal sale in 2003. There was a notable difference in the sale of these three items in 2001 and 2003.
In short, the popularity of the CDs is slowly decreased, while the DVD/Video increased remarkably in the whole world.
The chart below gives information about global sales of games software, CDs and DVD or video.
Write a report for a university lecturer describing the information.
Write a report for a university lecturer describing the information.
- You should write at least 150 words.
You should spend about 20 minutes on this task.
The given bar chart illustrates the changes in the global sales of game software, DVD/Video and CDs between the three years of 2000 to 2003.
There was a gradual slight drop in the sales of CDs during this three years period. In 2000, it was 35 billion dollars, reached to 31billion dollars in 2003. In case of games software, there was a slight continuous increase in the sales. In 2000, it was 12 billion dollars, which touched to 19 billion dollars in 2003, an increase of 7 billion dollars after three years. In the same period, the sales of CDs showed a significant increase without any drop. In 2000, it was 18 billion dollars reached at the peak of just above 30 billion dollars in 2003.
The sale of CDs was only one third of the sale of CDs in 2003, gained its popularity and became half of the sale of the CDs in 2003. The sale of the DVD/Video in 2000 was below half of the sale of the CDs in 2000, reached almost equal sale in 2003. There was a notable difference in the sale of these three items in 2001 and 2003.
In short, the popularity of the CDs is slowly decreased, while the DVD/Video increased remarkably in the whole world.
The chart below gives information about global sales of games software, CDs and DVD or video.
Write a report for a university lecturer describing the information.

3page0001.jpg
