Unanswered [2] | Urgent [0]
  

Home / Writing Feedback   % width   Posts: 4


IELTS: Graph - the amount of fast food consumed by juveniles in Australia


Nguyen Cuong 1 / 1  
Mar 30, 2019   #1

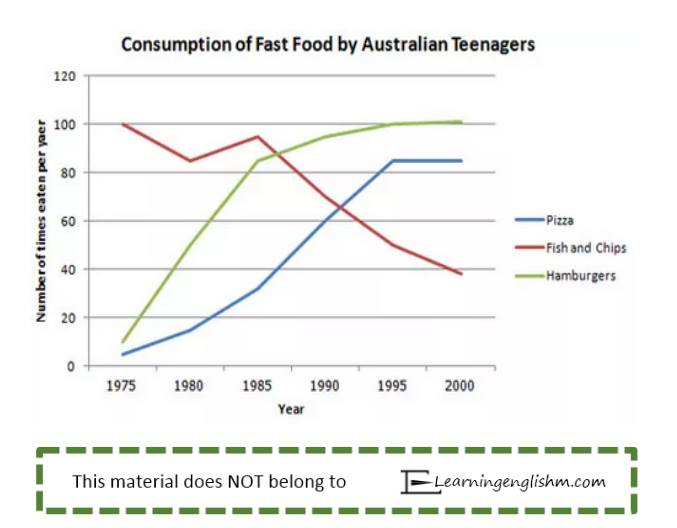
Consumption of fast food by Australian teenagers


The graph illustrates the expenditure of junk-food using by Australian teenagers over period 25-years
It is clear that the amount of food changed slightly.While the number of hamburgers ,fish and chips increased significantly,the consumption pizza decreased steadily from 1975 to 2000

In 1975,the amount of pizza was consumed by teenager at about 5 times.Additionally, the figure of hamburgers at about 10 times.while about 100 times the pizza-food was eaten by Australia middle-people.

By 2000, the expenditure of pizza rose dramatically at about 85 times. Additionally, the number of times Australian young-people eating hamburgers increased considerably at about 103 times and reached highest number over research period.By contrast, the consumption of fish and chips decreased substantially at about 39 times over 25 years

  • 53196602_10213645260.jpg


buttercup 1 / 3  
Mar 30, 2019   #2
Hi Cuong, here are some suggestions for your writing:

1. Ielts writing task 1 requires an essay of (at least) 150 words. Your essay is about 120.
2. You used the wrong word to describe the graph content: expenditure. Consumption here means "number of eating times". Expenditure means the amount of money spent which was not presented in the graph.

3. Avoid repeating words to many times.
4. Use adverbs more carefully not to make your essay sound clumsy.

Hope this helps!
Maria - / 1096  
Mar 30, 2019   #3
@Nguyen Cuong
A lot of your mistakes were based on writing technicalities. Because of this, I highly suggest rereading fundamental grammar-related queries for English. In particular, I want you to look into punctuation, prepositions, and articles. You have to be more straightforward and clearwith your essay.

For instance, I would paraphrase your first sentence as:
The graph illustrates the average expenditure on the consumption of fast food by Australian teenagers over a 25-year period.
This is a more professional approach to writing because of its structure and composition. Always follow a structure wherein you mention first the fundamental description of the graph before proceeding to introducing the timeline that it falls under. You had done something similar to this, however it does need a little bit more polishing and practice.

I also suggest looking into your usage of verbs and tenses in conjunction with what I had aforementioned. Make sure that you are clear as well with your language and articulation.

Let's take the first sentence of your second paragraph as an example. It should have been:
In 1975, the pizza consumption expenditure of teenagers was at 5 times. In comparison [...]
Avoid using the same transitions for your paragraphs because it can drag your essay, ie. you had used "additionally" twice in your essay when you could have opted for something else.
OP Nguyen Cuong 1 / 1  
Mar 31, 2019   #4
@Maria
thank you for your comment ^^.i'll rewrite again
@buttercup
hi buttercup.thank you for your advice.


Home / Writing Feedback / IELTS: Graph - the amount of fast food consumed by juveniles in Australia
Do You Need
Academic Writing
or Editing Help?
Need professional help with your assignments? Fill out one of these forms:

Graduate Writing / Editing:
GraduateWriter form ◳

Best Essay Service:
CustomPapers form ◳

Excellence in Editing:
Rose Editing ◳

AI-Paper Rewriting:
Robot Rewrite ◳