Unanswered [1] | Urgent [0]
  

Home / Writing Feedback   % width   Posts: 2


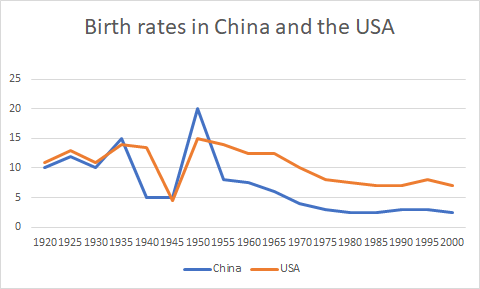
The graph demonstrates the variation in the birth rates of two countries, namely China and the USA


DungBui 2 / 2  
Aug 17, 2021   #1

the changes in the birth rates of China and the USA


The chart provided demonstrates the variation in the birth rates of two countries namely Chine and the USA in the period from 1920 to 2000.
In general, the birth rate of both countries witnessed some fluctuation before a slight decrease. Besides, the statistic of the USA was higher than that of China in most of the years.

Starting at roughly 10% in 1920, there was some variation in the birth rate of the USA, followed by a bottom out at less than 5% in 1945. After that, the birth rate of the USA surged to 15% in 1950. The statistic of the USA witnessed a slight dip in the remaining years apart from two times steadily rise to about 12% in 1965 and 7%.

Regarding the birth rate of China, there was an upward trend to 15% before plunged, hitting a bottom of exactly 5% in 1940. Subsequently, the statistic of China stabilized from 1940 to 1945, followed by a surge, reaching a peak at 20% in 1950.

  • 1.png


Holt  Educational Consultant - / 15384  
Aug 18, 2021   #2
While China is known as Chine in some parts of the world, the country must be referred to by the name in the image. The accuracy of the report is heavily scored and that includes the ability of the writer to use the provided information accurately. There should also bea more accurate recognition of the image given. Refer to the "line" chart because that is the precise name of the image. The "graph" is a general tim that should be converted into more accurate terms when reported.

from two times steadily rise to about 12% in 1965 and 7%.

Specific year references are needed to prevent information confusion in this statement.

The last paragraph has the least analysis presented. Add another sentence or two for a more balanced presentation. It must have a similar presentation to the first 2 paragraphs.


Home / Writing Feedback / The graph demonstrates the variation in the birth rates of two countries, namely China and the USA
Do You Need
Academic Writing
or Editing Help?
Fill out one of these forms:

Graduate Writing / Editing:
GraduateWriter form ◳

Best Essay Service:
CustomPapers form ◳

Excellence in Editing:
Rose Editing ◳

AI-Paper Rewriting:
Robot Rewrite ◳

Academic AI Writer:
Custom AI Writer ◳