Write a report for a university lecturer describing the information below.
- You should write at least 150 words.
- You should spend about 20 minutes on this task.
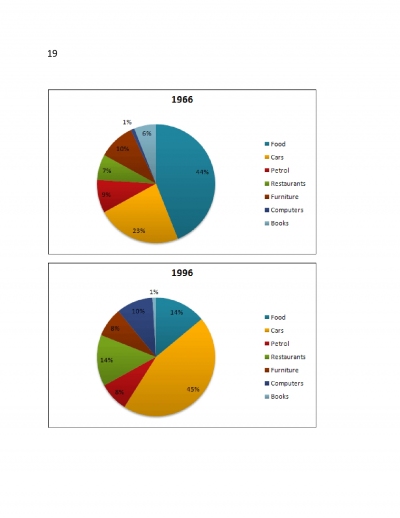
The given two pie charts compare the difference in the percentage of expense for seven items between the years 1966 and 1996. These items included food, cars, petrol, restaurants, furniture, computers and books.
At a glance, there were remarkable raise in the expense of three items in 1996, which are cars, restaurants and computers, whereas food and books expenditure reduced drastically. Petrol and furniture showed minimal changes. Turing to detail, in 1966, there were 44% of the total expense were spend for food which was reduced to one third percentage 14% in 1996. In case of cars and restaurant, spending shot up and reached double in 1996, which were 45% and 14% respectively.
The percentage of expenses for petrol and furniture displayed 1% of decrease and 2% decrease respectively that were minimal. The expense on books was declined to six times in 1996, 1% than in 1966, 6%. Computers showed a significant change. The demand of expense on computers shot up to ten folds in 1996 than in 1966 and stayed in 10%.
In short, there was notable increase in the expense of computers in the year 1996, which dropped the demand of expense on books to six folds in 1996. The total life style of the people was changed after 30yrs from 1966 that was demonstrated by the heaping in the percentage of expenses in cars and restaurants.
Write a report for a university lecturer describing the information below.
- You should write at least 150 words.
- You should spend about 20 minutes on this task.
- You should write at least 150 words.
- You should spend about 20 minutes on this task.
The given two pie charts compare the difference in the percentage of expense for seven items between the years 1966 and 1996. These items included food, cars, petrol, restaurants, furniture, computers and books.
At a glance, there were remarkable raise in the expense of three items in 1996, which are cars, restaurants and computers, whereas food and books expenditure reduced drastically. Petrol and furniture showed minimal changes. Turing to detail, in 1966, there were 44% of the total expense were spend for food which was reduced to one third percentage 14% in 1996. In case of cars and restaurant, spending shot up and reached double in 1996, which were 45% and 14% respectively.
The percentage of expenses for petrol and furniture displayed 1% of decrease and 2% decrease respectively that were minimal. The expense on books was declined to six times in 1996, 1% than in 1966, 6%. Computers showed a significant change. The demand of expense on computers shot up to ten folds in 1996 than in 1966 and stayed in 10%.
In short, there was notable increase in the expense of computers in the year 1996, which dropped the demand of expense on books to six folds in 1996. The total life style of the people was changed after 30yrs from 1966 that was demonstrated by the heaping in the percentage of expenses in cars and restaurants.
Write a report for a university lecturer describing the information below.
- You should write at least 150 words.
- You should spend about 20 minutes on this task.

5.jpg
