Unanswered [1] | Urgent [0]
  

Home / Writing Feedback   % width   Posts: 2


In the graph figures for the consumption per capita of Beef, Pork, Broilers, and Turkey in the US


ptthao0801 3 / 4  
May 28, 2023   #1

trends in US meat and poultry consumption


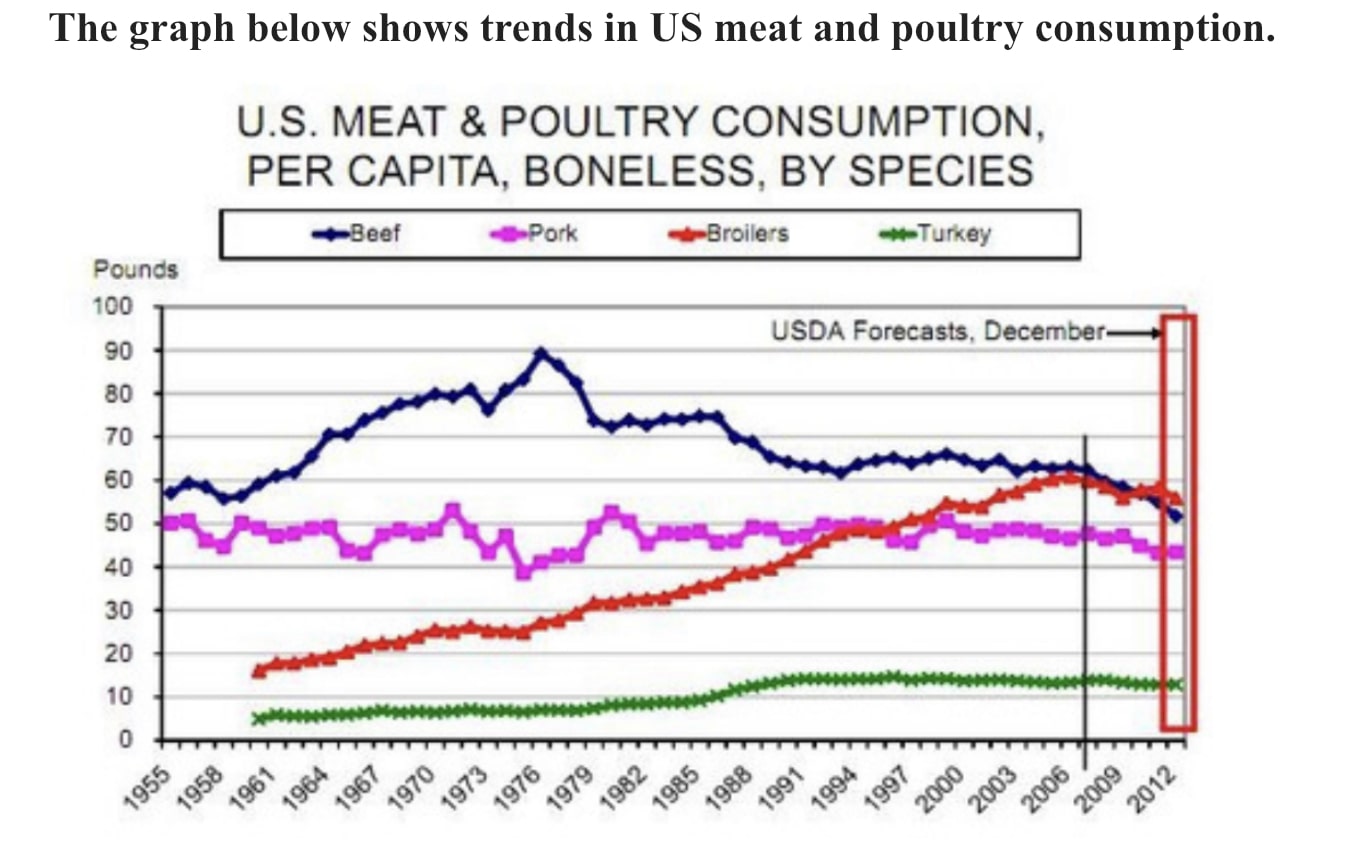
The given line graph compares figures for the consumption per capita of Beef, Pork, Broilers, and Turkey in the US between 1955 and 2012.

Overall, Broilers and Turkey went up in trends, while decreases were seen in Beef and Pork categories. Turkey remained the lowest in the amount of consumption over the given period.

From 1955 to 1995, Beef remained the highest in the amount of consumption with nearly 60 pounds in 1955 and reached a peak of 90 pounds in 1976. Pork came in the second position with 50 pounds consumed in 1955 and kept fluctuating until 2012. In contrast, Broilers and Turkey started with respectively 15 pounds and 5 pounds in 1960 and kept increasing over the period of time.

Broilers surpassed Pork in 1996 and ended up surpassing Beef with around 55 pounds consumed in 2012. Meanwhile, Beef and Pork went down steadily in trends with respectively 50 pounds and 41 pounds in 2012. Turkey saw a small rise in demand by only 5 - 6 pounds from 1995 to 2012.

(174 words)

  • F3F0AB007F8B4D7B8.jpeg


Holt  Educational Consultant - / 15384  
May 29, 2023   #2
One key element is missing from this presentation. These forecasts all end in December of 2012. These do not just cover a period until the year of 2012. There is a big difference in these references which also affect the accuracy of your report. Next time you have to make sure that you report all of the highlightable information in the summary overview. Additionally, make sure to use at least 3 sentences in the summary so that you avoid any GRA deductions in relation to long sentences.

Information for Turkey is also incomplete. What were the starting measurements? Additionally, pork and broilers have an overlap in measurements that you should be reporting in the comparison portion as well.


Home / Writing Feedback / In the graph figures for the consumption per capita of Beef, Pork, Broilers, and Turkey in the US
Do You Need
Academic Writing
or Editing Help?
Fill out one of these forms:

Graduate Writing / Editing:
GraduateWriter form ◳

Best Essay Service:
CustomPapers form ◳

Excellence in Editing:
Rose Editing ◳

AI-Paper Rewriting:
Robot Rewrite ◳

Academic AI Writer:
Custom AI Writer ◳