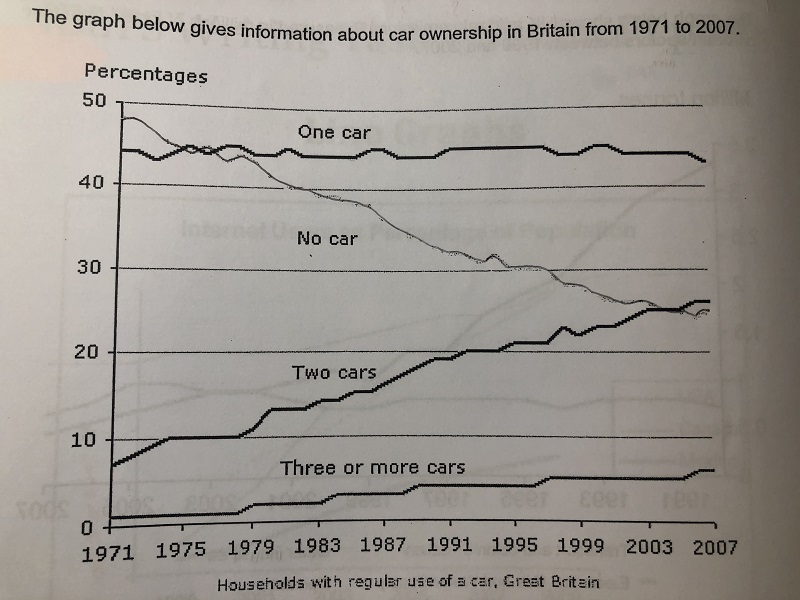
the Percentage of uk citizens who had a car
The line graph shows the proportion of people who owned cars in the United Kingdom between 1971 and 2007.
To summarized, people who had two cars rose gradually over a period of 36 years but people who didn't have any car declined steadily although it was the most common category at the first time.
In 1971, a significant changed we can see is that a downward trend in the people who didn't own a car, which is nearly half, but dropped by 20% in the final years. By 2007, around 10% of the amount of populations that had two cars increased considerately over a quarter.
British who had one car were over 40% from the first and remained stable from 1971 to 2007. There were the less people who owned three or more cars in the beginning, in spite of it climbed, which is mere 2%. In contrast, nearly 50% of the proportion of people didn't own any car in 1971.
Thanks!

IMG_6089111.jpg
