Unanswered [1] | Urgent [0]
  

Home / Writing Feedback   % width   Posts: 2


The graph gives information about the percentage of the population if four different Asian countries


mmmphugn 1 / -  
Aug 5, 2023   #1

urban population in asian areas


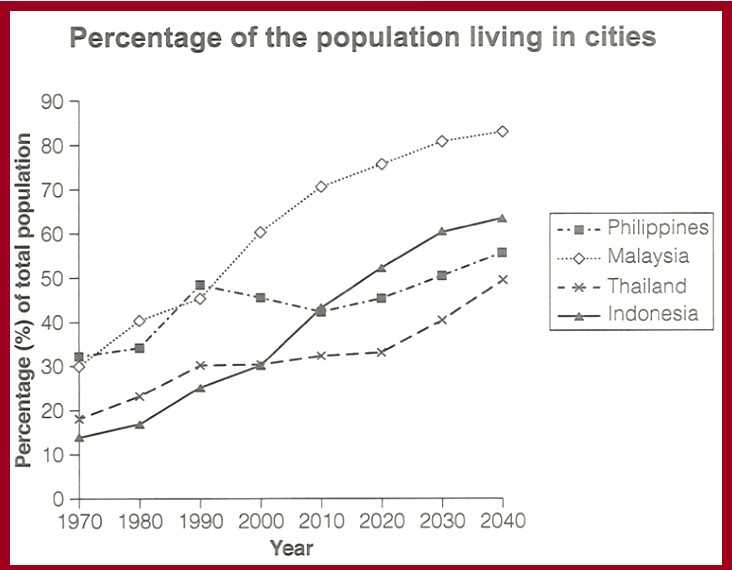
The given graph provides information about the proportion of the population living in urban areas in four different Asian countries: Philippines, Malaysia, Thailand, and Indonesia between 1970 and 2020, with predictions for 2030 and 2040.

Overall, the percentage of the population in four Asian countries living in the city has increased. It is notable that Malaysia has been the country in Asia having the biggest population living in the cities.

From 1970 to 2040, the proportion of the population living in cities in Malaysia and Indonesia has increased significantly. The figure for Malaysia increased from around 30% to nearly 80% between 1970 to 2020 and it is predicted to climb to approximately 90% in 2040. The number of people living in cities in Indonesia increased from over 10% in 1970 to 50% in 2020 and it will climb to 60% in 2040.

Between 1970 and 2040, the percentage of the population living in urban areas in Thailand and the Philippines has increased slightly. The change in the number of people living in cities in Thailand is bigger than the figure for the Philippines

  • tempsnipcompressed..jpg


Holt  Educational Consultant - / 15344  
Aug 13, 2023   #2
Use at least 2 sentences for the summary overview. You will get an impressive summary score if you use 3 sentences. Separate sentence ideas gain more points in this instance. You cannot expect to get a good preliminary score when you present a run-on sentence such as this at the very start of the presentation. You should focus on sentence clarity, which is not achieved when you write long, compressed idea sentences.

Asian countries living in the city

Singular v. Plural error. Countries is plura, city is singular. The reference should be in plural form as well, cities.

has increased significantly

You cannot say this. 2040 is a predictor, it is not reported as fact in the image. You should stop trying to compress your information, it leads to misleading references that will cause unnecessary errors in your LR, GRA, and C+C scores.


Home / Writing Feedback / The graph gives information about the percentage of the population if four different Asian countries
Do You Need
Academic Writing
or Editing Help?
Need professional help with your assignments? Fill out one of these forms:

Graduate Writing / Editing:
GraduateWriter form ◳

Best Essay Service:
CustomPapers form ◳

Excellence in Editing:
Rose Editing ◳

AI-Paper Rewriting:
Robot Rewrite ◳