Writing Ielts task 1 about graph
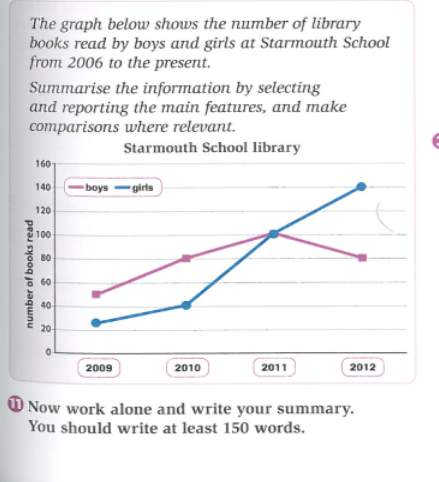
The graph gives us information about changes in the number of books read by boys and girls at Starmouth School library between 2009 and 2012.
We can see that from 2009 to 2010, the number of books read by boys were more than girls and increased sharply from about 50 to 80. However, during 2010, these figures also rose but were as fast as before. Specifically, there was a slight increase by 20 and peaked at 100 in 2011. And then, the number of books read by boys from 2011 to 2012 had been a downward trend. In 2012, figures droped to 80 and equal to the 2010's figures.
Beside that, the number of books read by girls went up considerably. In spite of the number of books read by girls were not equal to boys in 2009. And between 2009 and 2010, figures increase slightly to 40 but still were not as same as the number of books read by boys. However, from 2010 to 2011, there was a dramatic rose by 60 which were the same to the number of books read by boys which peaked at 100 in 2011. During 2011, this number continually rose and peaked at 140 in 2012. Over 3-year period, there was had been an upward trend.
Overall, the number of books read by boys were fluctuated therefore during the first year, these figures were higher than girls. But in 2012, this number dropped and the number of book read by girls increased significantly, 60 books more than boys.
PLEASE GIVE ME IELTS BAND. THANK YOU SO MUCH ^o^

401.728.0_r4xzxksmtx.png
