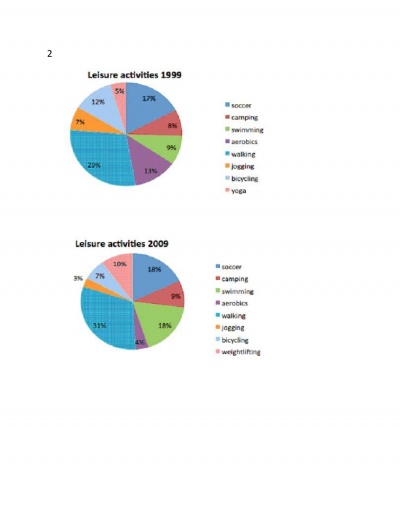
The following pie charts show the results of a survey into the most popular leisure activities in the United States of America in 1999 and 2009.Summaries the information by selecting and reporting the main features, and make comparisons where relevant.
The given two pie charts compares the popularity of leisure activities during the year 1999 and 2009 in America.
In 1999 there was very negligible difference between the percentage of yoga, jogging, camping and swimming. All shows below 10% popularity. The most popular leisure activity was walking which was 29% in the year 1999, increased to 31% after a decade.
The importance of aerobic exercises are decreased to one third after 10 years. In 1999 it was 13% reached to 4% in 2009. Soccer remained the same level roughly after the given period. Bicycle use as leisure activity fall from 12% in 1999 to 7% in 2009. Swimming became the favorable leisure activity and it doubled.
In short, in 2009, jogging dropped to half in 2009 and remained as the least popular free time activity. Yoga is replaced by weight lifting. Walking gained more importance. Soccer and swimming became second popular leisure activity.

2Epage0001__95.jpg
