Thank in advance you guys
I welcome any suggestion
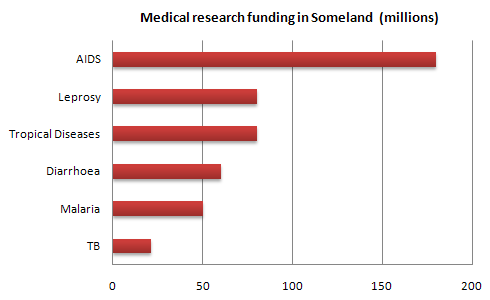
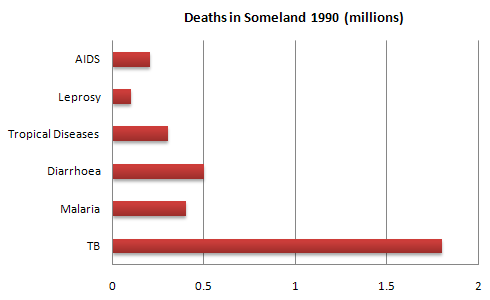
The graphs show the money spent on medical researches for some infectious diseases and mortality of those diseases in Someland in 1990.
A holistic view on 2 graphs shows that the necessary resources for research does not distribute properly according to the weight of the diseases in the way that some diseases with highest mortality received lesser money rather than diseases with lower mortality.
The comparison of two graphs shows that TB has the highest number of the death in 1990 with around 1.8 million deaths in year, however the money allocated for research on this disease was about 20 million. In contrast, disease such as AIDS with the least mortality on about 200.000 deaths in year received around 180 million. The same inequality can be seen for diseases like diarrhoea and malaria. Both diseases as second and respectively third killer among infectious diseases in Someland took less money than leprosy and tropical diseases with less mortality in 1990.
In conclusion, the graphs show that the money spent for research on different infectious diseases was not distributed according to the burden of the disease.

graph 1

graph 2
Hello Aria,
It is a nice writing but it will be more nice if you give attention on few matters:
1.As far I know both of them are bar Charts.
2 graphsTwo bar charts shows
2. Timing is important.As the time period was 1990.so u must write everything in past tense.But here you mixed which is major mistake in IELTS Exam:research doesdid not distribute properly ...
TB hashad the highest number of the death in 1990
overall writting is good
hello Dr. Aria. Hope u remember me n r doing well... As far as ur writing is concerned, I feel u have improved it considerably... U have explained most of the points very clearly. The few mistakes u did have been highlighted by Ratree. However, giving u a small tip-when the data is very less n u need to reach the word limit, then explain all the figures n data. And if data is too large, then explain only the main statistics n compare them...hope it helps...not too many days left for ur exam...good luck n cheers.
Here are some more ideas:
...shows that the necessary resources for research does do not distribute properly according to the seriousness of the diseases in the sense that research about diseases with some of the highest mortality received less money than research about diseases with lower mortality rates.
The comparison of two graphs shows that TB had ...
Both diseases as second and respectively third killer among infectious diseases in Someland took less money than leprosy and tropical diseases with lower mortality in 1990.
:-)
Great job, Aria!
Ajit, I wish everyone gave feedback as thoughtful as yours...
Ratree, thanks for those great corrections! Good call about the paste tense...
Thank you for all your comments,
There is a small problem regarding using the past time. Actually, I followed the instruction about the tenses in describing a graph or chart, from a material which its link is here: world-english.org/ielts_writing.pdf
there is said:
"Notice that the Simple Past tense used. Even though it describes
information from the past, the graph shows the information in the present
time" p(18)
I am wondering if there is reliable source or not?
tnx
hi Aria, well it seems u r getting a little confused because of too many opinions and advices. U can write sentences like the following-
" the bar graphs below show the estimated money spent on research on various infectious diseases and the mortality rate in 1990."
"the comparison of the two graphs show that TB had the highest number of deaths in 1990 with around 1.8 million deaths in the year."
- Just note this Aria- the above graph "shows" (present tense) that how the money was "spent" (past tense). The deaths already occurred, the money has already been spent, but the graph is showing u those facts at present. so use past tense for the facts my dear friend. Its not confusing if u read what i said properly.
Thank you ajit.
That was a great point. I hope I wont have the same issue in the future.
I think it is the best way for essay forum users to have a group of people who know eachother and are familliar more with our style of writing. at this way we can focous more on the pit falls and easier can reach to tthe points.
good luck
so use past tense for the facts my dear friend.
Yes! That's right... The chart shows (present tense) the facts about what happened (past tense).
This is the same as writing about literature. Thomas Friedman discusses globalization in The Lexus and the Olive Tree. He wrote the book many years ago, but we still write about it in the present tense because we experience the literature/chart right now in the present.


