You should spend about 20 minutes on this task.
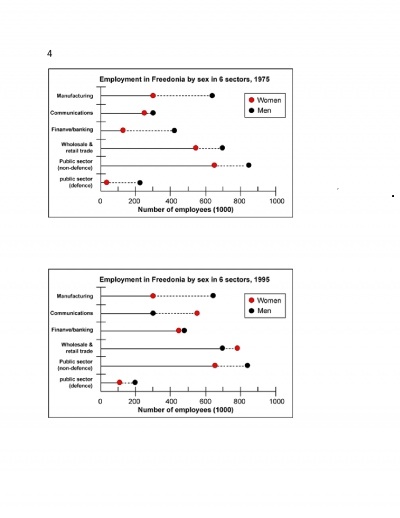
The graphs below show the numbers of male and female workers in 1975 and 1995 in several employment sectors of the republic of Freedonia.
Write a report for a university teacher describing the information shown.
You should write at least 150 words.
The given chart illustrates the employment in the republic of Freedonia in thousands by both sexes in six sectors in 1975 and 1995. In 1975, the number of man employees excludes the female employees' number in all sectors, whereas after two decades the women employment exceeds men in two sectors, wholesale and retail sector and communications.
In 1975, the public sector (defense), the number of women employment was only 25000 and male employment was 210,000, which was of four folds more than that of female employment. It shows a significant improvement in the female employment in this sector, which increased and became 50% that of the male employment after two decades. In case of employment in finance and banking in 1975 the male employment was four folds than that of the female employment. In 1995, there was a remarkable rise of four folds in female employment and reached at the level roughly equal to the level of the male employments. In communication field there was a negligible difference between the male and female employment in 1975. However, in 1995, the male employment remained the same level while women employment increased double and exceeded the male employment.
In short, the two sectors, manufacturing and public sector (non-defense), the rate of employment in both sexes remained roughly the same in the two years under review. Two sectors, female employment exceeded male employment in 1995.
You should spend about 20 minutes on this task.
The graphs below show the numbers of male and female workers in 1975 and 1995 in several employment sectors of the republic of Freedonia.
Write a report for a university teacher describing the information shown.
You should write at least 150 words.
The graphs below show the numbers of male and female workers in 1975 and 1995 in several employment sectors of the republic of Freedonia.
Write a report for a university teacher describing the information shown.
You should write at least 150 words.
The given chart illustrates the employment in the republic of Freedonia in thousands by both sexes in six sectors in 1975 and 1995. In 1975, the number of man employees excludes the female employees' number in all sectors, whereas after two decades the women employment exceeds men in two sectors, wholesale and retail sector and communications.
In 1975, the public sector (defense), the number of women employment was only 25000 and male employment was 210,000, which was of four folds more than that of female employment. It shows a significant improvement in the female employment in this sector, which increased and became 50% that of the male employment after two decades. In case of employment in finance and banking in 1975 the male employment was four folds than that of the female employment. In 1995, there was a remarkable rise of four folds in female employment and reached at the level roughly equal to the level of the male employments. In communication field there was a negligible difference between the male and female employment in 1975. However, in 1995, the male employment remained the same level while women employment increased double and exceeded the male employment.
In short, the two sectors, manufacturing and public sector (non-defense), the rate of employment in both sexes remained roughly the same in the two years under review. Two sectors, female employment exceeded male employment in 1995.
You should spend about 20 minutes on this task.
The graphs below show the numbers of male and female workers in 1975 and 1995 in several employment sectors of the republic of Freedonia.
Write a report for a university teacher describing the information shown.
You should write at least 150 words.

4compresses.jpg
