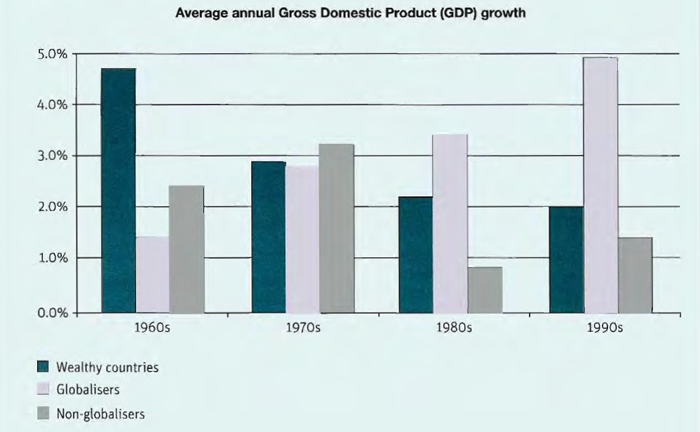
The graph below shows the average growth in domestic products in wealthy countries, countries that have adopted a global approach to business and countries that have not.
Answer:
The given bar chart shows the average GDP growth per decade for wealthy countries, globalisers and non-globalisers over a period of 40 years.
According to the data, after a ten-year period of the average GDP growth for wealthy countries, the figure decreased steadily from the 1970s to 90s, while globalisers showed the reserve during 40 years. Meanwhile, non-globalisers were a period of fluctuation for the annual GDP growth over 4 decades.
A closer look at the data reveals that the highest percentage of the GDP growth was recorded from wealthy countries with 4.8% per annum. However, this trend fell to 3% per year between 1970s and 90s. Then, it continued falling to a low of two per cent at the end of this period. Secondly, in the 1960s the average GDP growth for globalisers was approximately 1.5 per cent, and then doubled in the 1970s, with nearly 3%. This figure continued to rise in the 1980s with 3.3% of the GDP growth, not leveling off until the 1990s, which had led the GDP figures for the wealthy countries. Lastly, non-globalisers were a slight increase in the first two decades, with 2.3-to-3.1 per cent. By the 1980s this figure decreased dramatically, just less than 1%, although it recovered slightly towards the end of the year, with 1.3% of the GDP growth.
Clearly, the average GDP growth from 3 different types of countries had changed considerably during 4 decades.

annual_GDP_small.png
