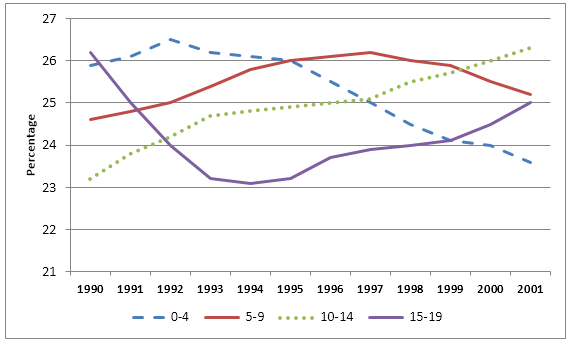
structure of the young population in the UK
The line graph depicts the proportion of citizens under 20 years old divided into 4 main age groups in the United Kingdom from 1990 to 2001.
In general, the ratio of infants from 0 to 4 years old witnessed a dramatic downfall, whereas that of 5-9, 10-14, and 15-19 children age groups saw an opposite movement.
In 1990, roughly just over a quarter of the total population of the UK was children from 4 to 10 years old and from 15 to 19 years old. After reaching its peak at 26,5% in 1992, the figure for infants started to fall steadily to just under 24% in 2001, which was matching with that of 15-19 years old adolescents in 1999. In terms of 15-19 children's percentage, which sharply dropped in the nearly first half of the given period and bottomed out at 23% in 1994, followed by a gradual increase to 25% in 2001.
Furthermore, 5-9 and 10-14 years old children groups increased steadily from 25% for the former and 23% for the latter to 26% and precisely 25%, respectively and this matched with the number of infants in 1997. At which point, the ratio of 10-14 group saw a steep upward to just over 26% in 2001. By contrast, a slight fall to 25% was experienced by the 5-9 youngsters' group at the end of the period.

ieltsgraph308chil.png
