Unanswered [2] | Urgent [0]
  

Home / Writing Feedback   % width   Posts: 5


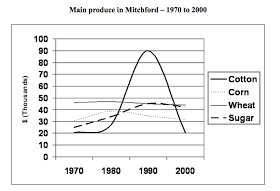
WT1: The graph below shows the four leading types of farming produce in Mitchford city 1970-2000


jadeatoz 2 / 8  
Jul 23, 2017   #1

popularity of agricultural products in Mitchford


The graph compares the consumption of the top four types of agricultural products in Mitchford over a period of 30 years.

As an overall, cotton was by far the most important produce contributing to the Mitchford economy due to its increased demand between 1980 to 1990. The production of wheat, corn and sugar were comparable and remained relatively constant over the period shown.

In 1970, wheat was the main produce making just under 50 thousand dollars for the city. During the same period, the money which came from corn and sugar produce were comparable with 25 and 30 thousand dollars respectively. However, cotton provided a negligible amount of 20 thousand dollars and just one year later, cotton overtook wheat in making a contribution to Mitchford agriculture.

From 1970 to 1990, this city saw a considerable increase in cotton consumption until it reached a peak of 90 thousand dollars. The figure for corn fluctuated slightly and stabilised for the rest of the period. In the early 2000, the production of sugar, wheat and cotton were equal and tended to decrease since then. While cotton production fell roughly again to 20 thousand dollars and was likely to follow this trend, the other three ones varied slightly and may go up after that.

  • ggggggg.png


Holt  Educational Consultant - / 15344  
Jul 23, 2017   #2
Jade, your essay is good in covering the discussion of the graph. However, you only presented body paragraphs in this essay. You did not represent a summary of the presentation plus an outline of the discussion that was to come forth. The summary could have come either as an opening statement or a concluding summary. Neither were represented in your essay. The summary outline is actually one of the most important factors that is considered in the scoring process so you should never neglect to present that summary in the essay. Don't be confused, the summary overview cannot contain any of the actual information found in the graph. Rather, it is to give information regarding the discussion topics for the essay in a summary form. No facts or figures yet. If I were to write the summary introduction for this essay, it would similar to:

A graph was provided showing the 4 top farming products of Mitchford City. The products, including their selling price in dollars were monitored over the decades from 1970 up to 2000. This essay will present a more detailed analysis of the graph and the information that accompanied it.

While your grammar is not perfect, it did not pose any stress on the reader. Your information was understandable and a degree of analysis is evident in your work. This is a pretty good attempt at writing a task 1 essay. Save for the missing summary statement, which is a requirement of the essay, you did an acceptable job of writing the body paragraphs though.
OP jadeatoz 2 / 8  
Jul 23, 2017   #3
@Holt Thank you so much. I have some questions for you. In task 1, writing an opening summary or concluding summary, which one is better? Do I need to write both of them? And how many words should task 1 need to have? I feel quite confused. Thank you again!
juntrinh 3 / 4  
Jul 24, 2017   #4
Hi jadeatoz,

I have some recommendations to you

"cotton was by far the most important produce". It's better if you change "produce" to "product"
Regarding relative clauses, you should use "that" instead of "which". You aren't wrong, but it sounds more native.
...production of sugar, wheat and cotton were equal and tended to decrease since then --> wheat and cotton were equal, and they tended to... You should separate them into two clauses because they are not parallel.
hi021132 6 / 11  
Jul 24, 2017   #5
Hi jadeatoz, you may also mention that the only overall consumption increase throughout the 30-year period was in sugar.


Home / Writing Feedback / WT1: The graph below shows the four leading types of farming produce in Mitchford city 1970-2000
Do You Need
Academic Writing
or Editing Help?
Need professional help with your assignments? Fill out one of these forms:

Graduate Writing / Editing:
GraduateWriter form ◳

Best Essay Service:
CustomPapers form ◳

Excellence in Editing:
Rose Editing ◳

AI-Paper Rewriting:
Robot Rewrite ◳