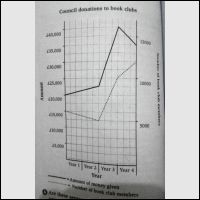
The given line graph illustrate amount of money donated by city council to book clubs in past four years. Overall, it can be seen from the graph that there was a fluctuation contribution from city parliament to the book associations while it provides an upward trend for a number of book club members over the period.
At the beginning of the period, city congress donated £20,000 to these associations. Then, it increased steadily of £25,000 in the second year. This particular upward trend continued for the following year and it reached a peaked at £40,000. However, in the end of the period, council donations to the book clubs decreased suddenly to just over £5,000.
On the other hand, book club members experienced an upward trend until end of the period although there was a slight decrease in the first two-years period but it dramatically went up to 10000 members in the third years. However, it reached a peaked at 12000 people in the fourth year.
In conclusion, there was no significant relation between how much the city charity that given and the number of book club members at the end of the period.

donation.jpg
