Unanswered [2] | Urgent [0]
  

Home / Writing Feedback   % width   Posts: 2


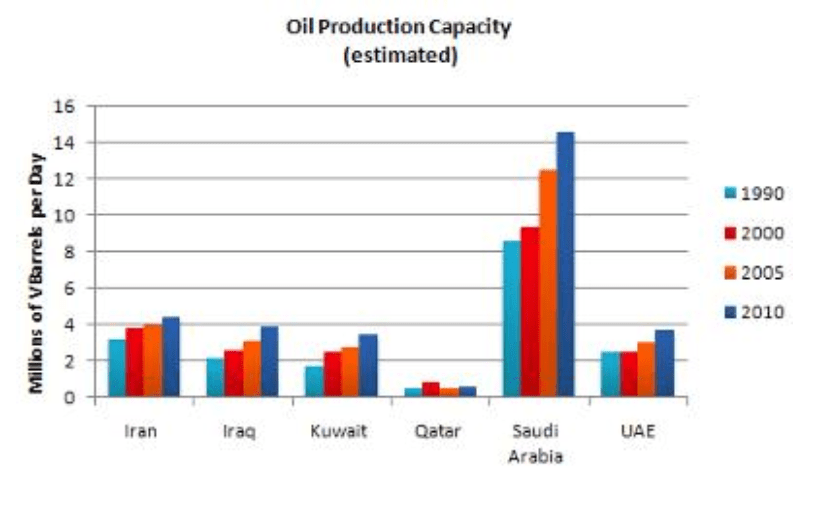
The graph shows oil production capacity for several Gulf countries between 1990 and 2010.


Thang113 1 / -  
Sep 10, 2023   #1

estimated oil production capacity


The bar chart illustrates the amount of oil in six nations, namely Iran, Iraq, Saudi Arabia, UAE, and Kuwait from 1990 to 2010.
Overall, it can be seen that Saudi Arabia was the country that produced the highest oil. The oil production in Qatar remained relatively stable.
In 1990, the amount of oil in Saudi Arabia and Qatar were around 8 and nearly 2 millions of barrels respectively. Twenty years later, the oil production of Saudi Arabia reached a peak of nearly 16 millions barrels. From 2005 to 2010, Qatar produced just only 2 millions oil on a daily basis after increasing to 1.5 in 2000.

Iran produced 3 millions of barrels every day in 1990, followed by Kuwait and Iraq produced about 2 million of barrels in the same year. The amount of oil production in Iran increased slightly, reaching 4 millions oil in 2005 and 2010. Oil production in Iraq, Kuwait, and UAE was as the same nearly 4 millions of barrels in 2010.


Holt  Educational Consultant - / 15169 4859  
Sep 25, 2023   #2
The presentation is good. You did your best to present the information properly and coherently to the examiner. However, there are several word usage errors such as millions, instead of million, which will affect the LR score of your essay. The overall comparison presentation can still be improved as you have limited the actual comparison between the countries provided. That is not to say that the presentation is not effective because it is. You delivered in terms of the short form information required for the essay. Doing a little more by adding an insightful analysis of the information would have helped further increase your score. Right now, you have done only enough to get a good score, but not really well enough to not have the penalties that will be applied affect the final outcome. You need to try and write at least 175 words.


Home / Writing Feedback / The graph shows oil production capacity for several Gulf countries between 1990 and 2010.
Do You Need
Academic Writing
or Editing Help?
Need help with your assignments? Fill out one of these forms:

Graduate Writing / Editing:
GraduateWriter form ◳

Best Essay Service:
CustomPapers form ◳

Excellence in Editing:
Rose Editing ◳

AI-Paper Rewriting:
Robot Rewrite ◳