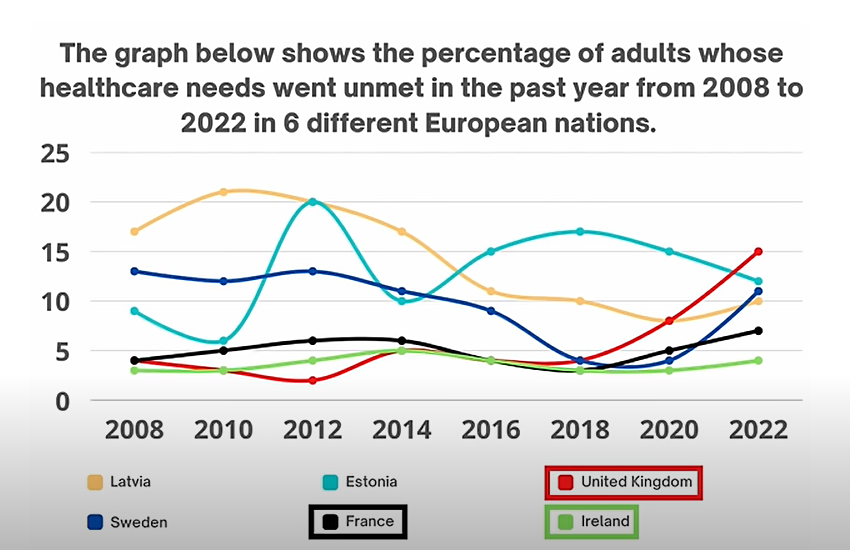
The line graph demonstrates the proportion of adults with inadequate healthcare needs over the past 14 years from 2008 to 2022 in 6 various European states.
Overall, except for Estonia, the figure for all countries increased in 2022. Latvia, Sweden and Estonia witnessed the largest fluctuation while the remaining nations remained relatively stable. Moreover, the figure for the UK underwent a dramatic change, starting from the lowest in 2012 before peaking the highest in 2022.
To begin with, Latvia ranked first with the highest number, specifically beyond 20% in 2010; however, this steadily dropped to below 10% in 2020. The figure for Estonia began with slightly above 5% in 2010 and then soared to 20% in 2012 prior to failing again to 10% in 2014. As distinct from two mentioned nations, Sweden saw moderate changes from 2008 to 2014. However, in 2016, the country gradually declined, accounting for below 10% of the total, which remained the same at around 5% between 2018 to 2020 previously increasing substantially to over 10% in 2022.
France, the UK and Ireland all varied between around 2% and 5% in 2008 and remained relatively steady until 2018. As can be seen from the graph, the UK had a dramatic increase, representing approximately 5% of the total in 2018 and making up the highest percentage in 2022. By contrast, the lowest proportion was in Ireland, which only rose from about 3% in 2020 to a tiny less than 5% in 2022.

Screenshot_26.png
