Unanswered [5] | Urgent [0]
  

Home / Writing Feedback   % width   Posts: 2


The graph and table shows the amount of water used for various purposes


nghiaphong 1 / -  
Oct 23, 2023   #1

water use worldwide and water consumption


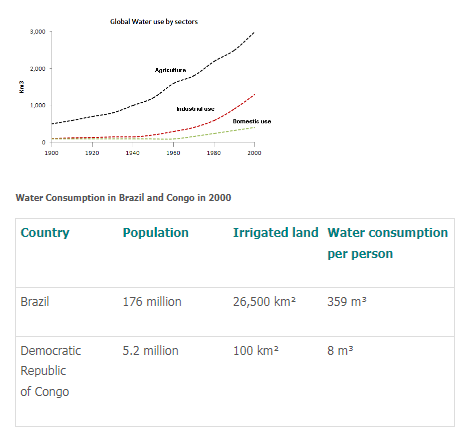
The given line and table chart illustrate the amount of water used for various purposes including Agriculture, industrial and domestic use around the world from 1900 to 2000 and water intake in brazil and Congo in 2000.

Looking from an overview perspective, it is readily apparent that water used by all 3 sectors experienced an upward trend over 100 years surveyed, while, congo which was the country lacked clean water for people's life.

Taking a glance at the line chart, between 1900 and 1960, the data of water consumed for industrial and domestic went up slighly to approximately 200〖km〗^3 and 100〖km〗^3 respectively, while, that of agriculture rose significantly from 500〖km〗^3 to 1000〖km〗^3. In the next 40 years that of industrial continued to increase about 1500〖km〗^3. Similarly, water consumption for domestic went up and took the minority with about 500〖km〗^3. At the same time, that of agriculture witnessed an unpredictable rise to about 3000〖km〗^3 and took the lead. In terms of the table, the population of Brazil was 176 million, being 170.8 million more than that of Congo with 5.2 million. Whereas Brazil had irrigated land acreage is 26500〖km〗^2, comparing with Congo with 100〖km〗^2. Furthermore, Congo which was a country lacked clean water with only 8m^2 water consumption for each person, being less than that of Brazil with 359m^2.

  • luuu.png


Holt  Educational Consultant - / 15393  
Oct 26, 2023   #2
Your first paragraph is going to earn you a failing preliminary GRA score. Avoid writing long sentences in that section. Run-on sentences are unacceptable in academic writing. You have compressed at least 3 ideas in that paragraph. Those ideas should actually be represented by one sentence each. That way you deliver a clearer and more understandable explantion to the reader. The intent of the paragraph is also better seen in the first pass reading.

The reporting paragraph is even more confusing for the reader to follow. You have compressed 2 paragraphs into one paragraph and then used confusing or specialized reference presentations in the paragraph. You are writing this essay for a person who is not an expert in the field and will not understand what your special characters mean. This essay might end up with a lower than expected score in an actual test.


Home / Writing Feedback / The graph and table shows the amount of water used for various purposes
Need Writing or Editing Help?
Fill out one of these forms:

Graduate Writing / Editing:
GraduateWriter form ◳

Best Essay Service:
CustomPapers form ◳

Excellence in Editing:
Rose Editing ◳

AI-Paper Rewriting:
Robot Rewrite ◳

Academic AI Writer:
Custom AI Writer ◳