I think that the graph was drawn in at least more than 10 years, but I still use the tense for prediction. According to the question, here's the estimated rate:
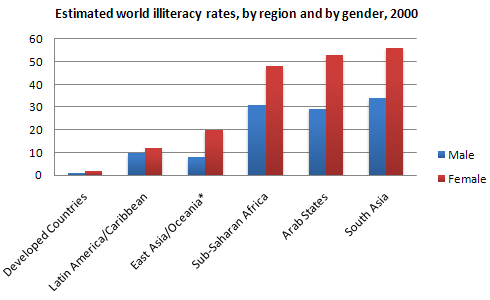
The chart below shows estimated world literacy rates by region and by gender for the year 2000.
Write a report for a university lecturer describing the information below.
The chart reveals predictions about the rate of illiteracy based on region and gender in the 2000.
It can be seen that South Asia is forecast to have the greatest proportion of illiterate men and women, at 44% and 56% respectively. Two other regions predicted to have the substantial illiteracy rate are Arab states (52% 0f women and 29% of men) and Sub-Sahara(48% of men and around 31% of women). East Asia/Oceania and Latin America/Caribbean are expected to have a lower rate of the illiterate, at 20% females and 9% of males in the former region as opposed to 11% of females and 10% of males in the latter. However, the smallest percentage of illiterate people will belong to developed countries, at virtually 0%.
Another striking trend is the illiteracy rate of women seems always higher than that men. In South Africa, Arab states, Sub-Saharan Africa and East Asia/Oceania, it is predicted that figures shown for women will almost double those for men. Yet, the percentage of illiterate women is expected to outstrip that of men by a narrow margin in the remaining regions.
To recapitulate, the illiteracy rate in developing countries tend to be much higher than in developed countries. In addition, fewer women than men are expected to be able to read and write in the year 2000.

G58.gif
