Unanswered [1] | Urgent [0]
  

Home / Writing Feedback   % width   Posts: 2


The graphs show the result of a survey of computer ownership total and by education level


ashleycyw 1 / -  
Aug 30, 2019   #1

computer ownership 2002-2010 statistics


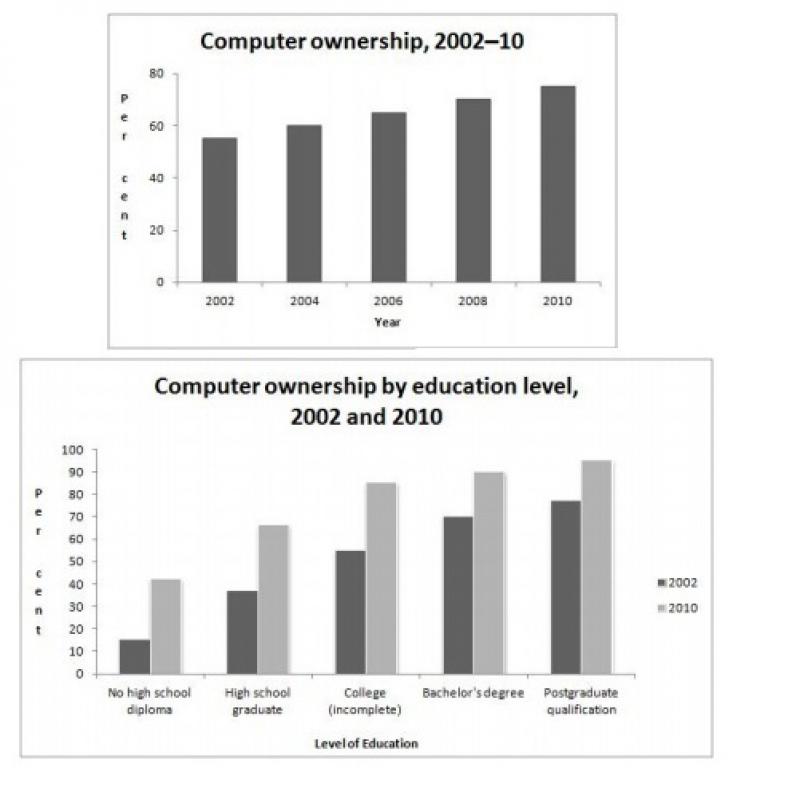
The graphs show us the result of a survey of computer ownership and computer ownership by education level as a percentage of the population between 2002 and 2010.

Generally speaking, there was a slight increase from 2002 to 2010. The percentage of 2010 computer ownership has almost 80 percent, 2010 has the highest percentage of computer ownership while 2002 has only almost 60 percent, that was the smallest percentage of computer ownership between the year of 2002 to 2010.

As is illustrated in the second graph, the Postgraduate qualification has the highest percentage among the 5 levels of education, whether in 2002 (70 percent) or 2010 (90 percent). It is interesting to note that the percentage of Bachelor's degree in 2002 has the same percentage of High school graduate in 2010 (almost 70 percent).

In summary, it is clear that 2010 are more likely to have computer ownership by five education levels.

  • ac_writing.jpg


Maria - / 1096  
Sep 5, 2019   #2
@ashleycyw
Hi there. I see that you're new here - welcome to the forum. Let me provide you with writing feedback on your essay in order to help you in your writing endeavors.

First and foremost, the second paragraph lacks that critique of the graph. While you were merely describing how things were being reflected in the writing, this portion lacks that sensitivity of showcasing how this translates to a more in-depth analysis. If you can present even a slither of how this translates into the real-world, it would be beneficial for the overall outlook of this essay.

Having said that, I also find that the general feel of your essay is quite informal. I would recommend that you try to keep everything in a formal manner. For instance, take a look at your third paragraph. The writing appears to be rather bland because of how the structure is plotted to be. I heavily recommend that you add more punctuation and pauses all throughout. Doing this would enable the readers to have a more enhanced outlook of the writing.


Home / Writing Feedback / The graphs show the result of a survey of computer ownership total and by education level
Do You Need
Academic Writing
or Editing Help?
Fill out one of these forms:

Graduate Writing / Editing:
GraduateWriter form ◳

Best Essay Service:
CustomPapers form ◳

Excellence in Editing:
Rose Editing ◳

AI-Paper Rewriting:
Robot Rewrite ◳

Academic AI Writer:
Custom AI Writer ◳