Writing Task 1
The graphs below provide information on global population figures and figures for urban populations in different world regions.
Summarise the information by selecting and reporting the main features, and make comparisons where relevant.
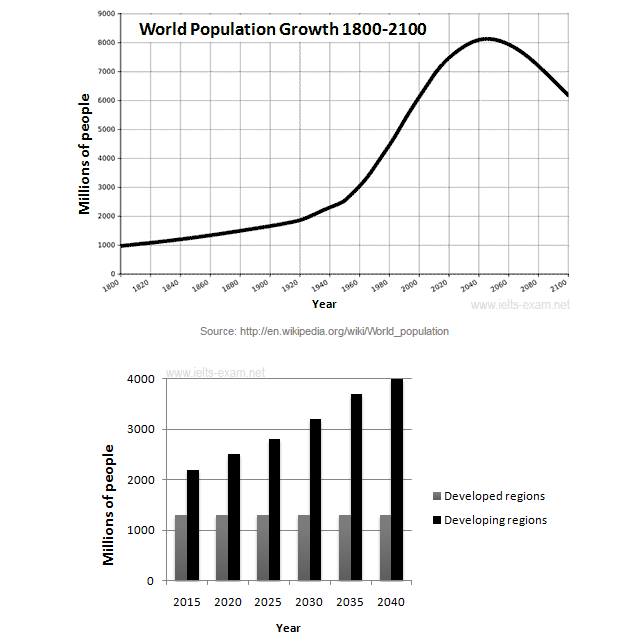
The line chart gives the information regarding the growth of population in the worldwide over 3-centuries period, and the bar chart illustrates the number of the urban community in both developed and developing areas spread the world from 2015 to 2040 and are measured in millions of people. Overall, the world community growth increasing steadily and decrease in the last 5-decades period. It also can be seen that the developed areas have a significant rise while the figure for developing areas remained stable over a 25-years period.
In the first period, the number of people globally stood at 1,000 million which increased gradually to 2,000 million in 1920. Next, there has been a dramatic rise from since 1920 until now. Moreover, it will peak at roughly 8,000 million in 2040. Surprisingly, there is a prediction that the population of people will fall slightly to 6,000 million in 2100.
Throughout the bar chart, there was approximately 2,100 number of societies lived in the developing area, which will increase gradually in the next period and will peak 4,000 million in 2040. However, it will be different with the developed regions since there are a similar figure over a 25-years period. It means that the population in the area that already developed will have same occupants from 2015 to 2014 at nearly 1,200 million.

World_population.jpg
