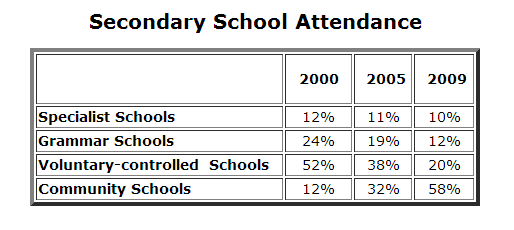
The high school attendance was revealed by the table in three periods that were divided among 2000, 2005 and 2009. While there were four of school classifications, most of them showed a decrease of presence percentage over the time frame. But, there was a gradually increase in one school major.
Turning first to Community Schools, It stood at 12% in 2000, then slightly rose over two times of following period in 2005. Interestingly, while Schools of Community were the lowest in the first period, it significantly grew to 58% in the end of period, the greatest attendance among three others.
In contrast, two of schools were the higher presence in 2000, Voluntary-controlled schools (52%) and Grammar Schools (24%). In 2009, both noticeably fell to approximate a half of the beginning, 20% for Voluntary-controlled and 12% for Grammar major. Finally, there was not much different with Specialist Schools which were 12% of attendance in 2000. Next, it steadily declined by 2% and reached 10% in 2009.

ES8.png
