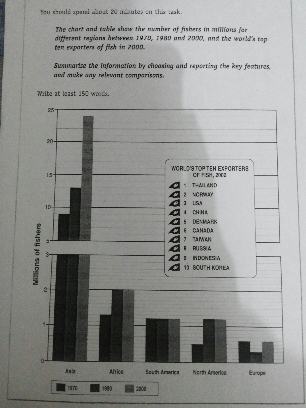
The chart and table show the number of fishers in millions for different regions between 1970, 1980 and 2000, and the world's top ten exporters of fish in 2000
The bar chart illustrates the population of fishers in Asia, Africa, South America, North America and Europe, and is measured in millions from 1970 to 2000. However, the table compares the top ten exporters of fishing in 2000.
It is noticeable that the population of fishers inclines in five countries. However, the number of fishers in Asia dominates and records the top exporters of fishing.
The highest number of fishers was experienced by Asia in 1970. Whereas the figure of Africa, South America stood at around 1.2 million fishers, North America and Europe fishers held the lowest percentage in all countries. In any case, the population of Asian fishers increased significantly from 15 million to 24 million between 1980 and 2000, a rise of about 9 million in a year. Standing in contrast, the number of African, South American and North American fishers leveled off from 1980 to 2000 at 2 million and 1.2 million. In 2000, the figure of European fishers had gradual rebound to the same number in the first period at 6 million.
Turning to the table for world's top ten exporters of fish, in 2000, Thailand became the top exporter of fish. Then Norway followed in the second position and America held the third position in top ten exporters of fish. However, there were five countries of Asia which recorded in the list of top ten exporters of fish in 2000.

20140629_19.33.40..jpg
