TOPIC
The bar chart illustrates the import situation of coffee and tea goods in four different countries which include Canada, UK, USA, and Germany in 2002.
overall, this is a clear disparity in the import of tea in the four nations, in which tea seems to be the most important in the UK. Whereas, the amount of imported coffee is found around 4000 tones in all four countries.
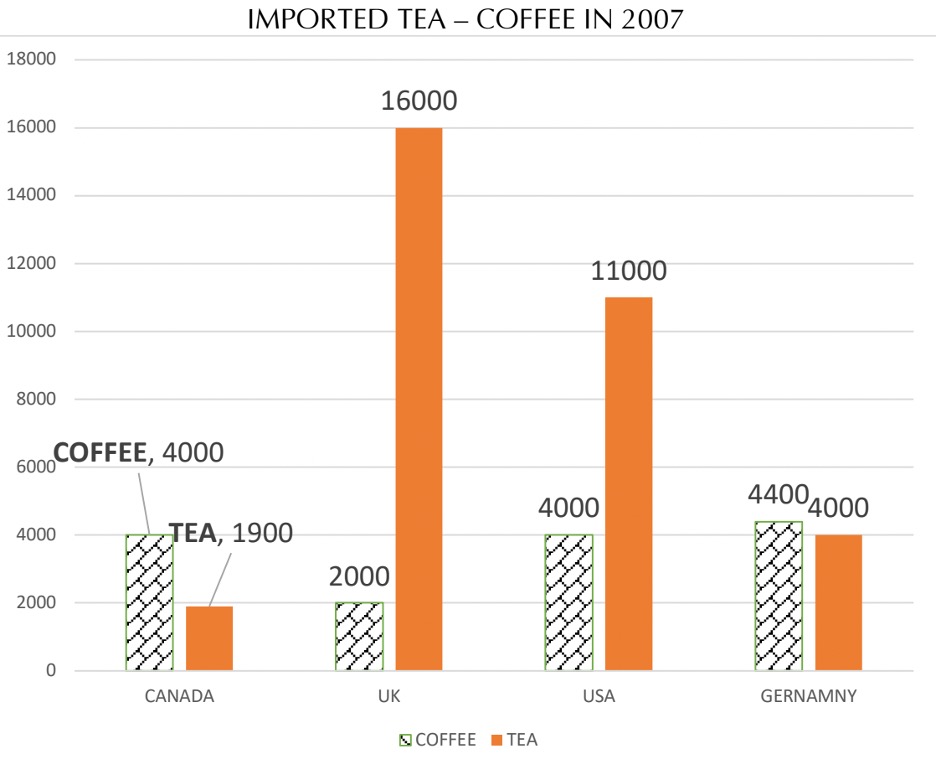
Regarding to the amount of tea imported, the largest amount of tea was imported from the UK accounting for 16 000 tones, followed by the USA, Germany, and Canada, with 11 000 tones, 4000 tones, and 1900 tones, respectively.
In terms of coffee, it is a different story. Considerably, although the UK imported the highest amount of tea, the consumption of coffee in there is the opposite, the data on coffee was the lowest which is only 2000tones. Turning to Canada and USA, they import the same quantity of coffee which is 4000 tones per year. Obviously, the quantity of coffee was consumed which is the highest and double the quantity of coffee in the USA.
The chart shows the amount (in tones) of tea and coffee imported to four countries in 2007.
The bar chart illustrates the import situation of coffee and tea goods in four different countries which include Canada, UK, USA, and Germany in 2002.
overall, this is a clear disparity in the import of tea in the four nations, in which tea seems to be the most important in the UK. Whereas, the amount of imported coffee is found around 4000 tones in all four countries.
Regarding to the amount of tea imported, the largest amount of tea was imported from the UK accounting for 16 000 tones, followed by the USA, Germany, and Canada, with 11 000 tones, 4000 tones, and 1900 tones, respectively.
In terms of coffee, it is a different story. Considerably, although the UK imported the highest amount of tea, the consumption of coffee in there is the opposite, the data on coffee was the lowest which is only 2000tones. Turning to Canada and USA, they import the same quantity of coffee which is 4000 tones per year. Obviously, the quantity of coffee was consumed which is the highest and double the quantity of coffee in the USA.

HINH.jpg
