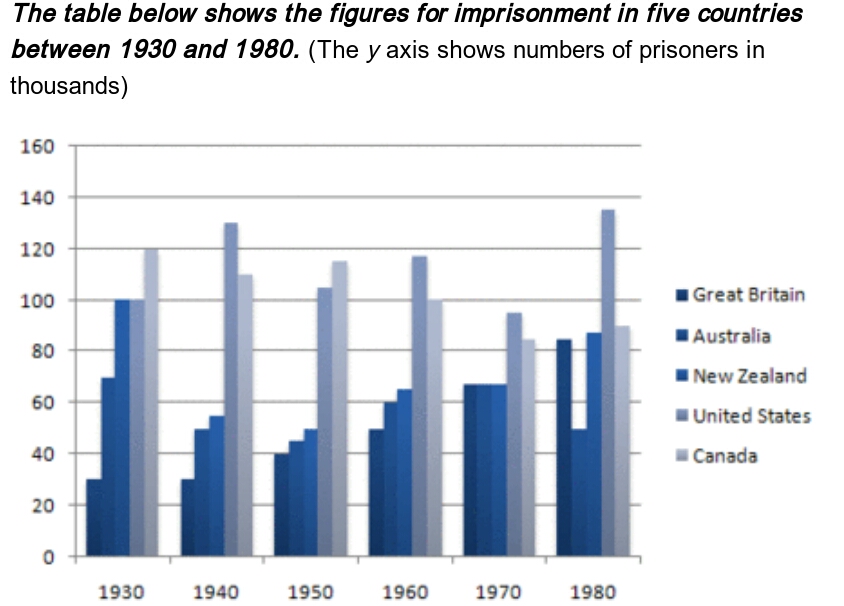
The chart compares the figures for imprisonment among five major countries in five decades. (1930-1980)
While the figures fluctuated over the period shown, it is noticeable that the USE had the highest number of prisoners. On the other hand, Great Britain had the lowest number of prisoners for the majority of the years.
According to the figures, the Great Britain prisoners had increased steadily from 30000 in 1930 to 80000 at the end of the period. On the other side, in Australia and New Zealand the
number of prisoners fell sharply just under 50000 in decade period. During the period, the number of prisoners increased gradually in three countries. (UK, Australia, New Zealand) These countries showed the similar number of
prisoners more than 60000 in 1970s.
Canada had the highest number of prisoners compared to other four counties. However this result decreased over the period
from 1930 to 1980 with fluctuation. Finally, the population of UnitedState prisoners increased rapidly from the beginning of
the year until the end of the period with again fluctuation.

PicsArt_139557892142.jpg
