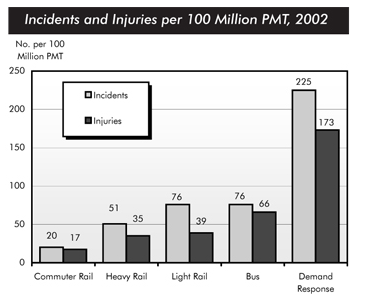
The bar chart compares the number of incidents and injuries per 100 million passenger miles travel (PMT) in 5 transportation modes during a period of time in 2002
Overall, there were more incident than that of injuries in the overall trend. Likewise, the vast majority of incidents and injuries occurred on the demand-response transport in 2002.
As per the bar chart, 225 million PMT incidents and 173 million PMT injuries engaged with the demand response. It was more than 10 times higher than the number on commuter rail which had 20 incidents and 17 injuries. While light rail and bus showed the resemblance number at 79 incidents, the trend of incident smaller in number at the trend of heavy rail being reckoned 51 million cases.
A more detailed look at the bar chart reveals that the gap between incidents and injuries in number was not always similar. The heavy rail trend had the largest as 16 million gaps accounted between incident and injuries. While the 10 millions gaps showed in term of bus, the gap in commuter rail narrowed considerably as the smallest gap over the overall trend. Besides, the wider gap was shown in the light rail and demand response. Although the trend of light rail had 37 gaps, such number was relatively smaller than the 53 gaps which saw in the demand response.

injuries_per_million.png
