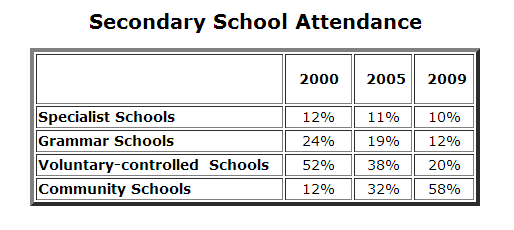
The table reveals with regard to the percentage of students who be present the secondary school in four type of schools in three different years. Overall, it can be seen that the intention of students to go to their schools change every period.
The percentage of student attendance experience a different pattern every year. In Specialist Schools, it remained stable over the period. It stood at 12% in the beginning year, and community schools experienced the same number as it, while Grammar School was twice higher than they had. The highest percentage in 2000 belonged to Voluntary-controlled Schools, it had 52%.
In 2005, three of the schools experienced a decrease pattern of their student attendance, then another was an increase. The percentage of Specialist Schools decrease one percent from the beginning year, while Grammar School fell to 19%. Even though The Voluntary-Controlled School witnessed a decrease trend of 38%, it was still the highest percentage of student attendance in the period. In contrast to Community School which was the only one experienced a grow pattern from 12% to 32% in the second year.
Furthermore, the second year pattern repeated in 2009. They kept decline except community school. It reached a peak at 58%, then defeated The Voluntary-Controlled School which was a decrease of 18%. The percentage of student attendance in Grammar School also fell to 12%, and Special School experienced a gradual drop of 10%.

ES8.png
